A Simple Step-by-Step Guide
Set the Key Assumptions First
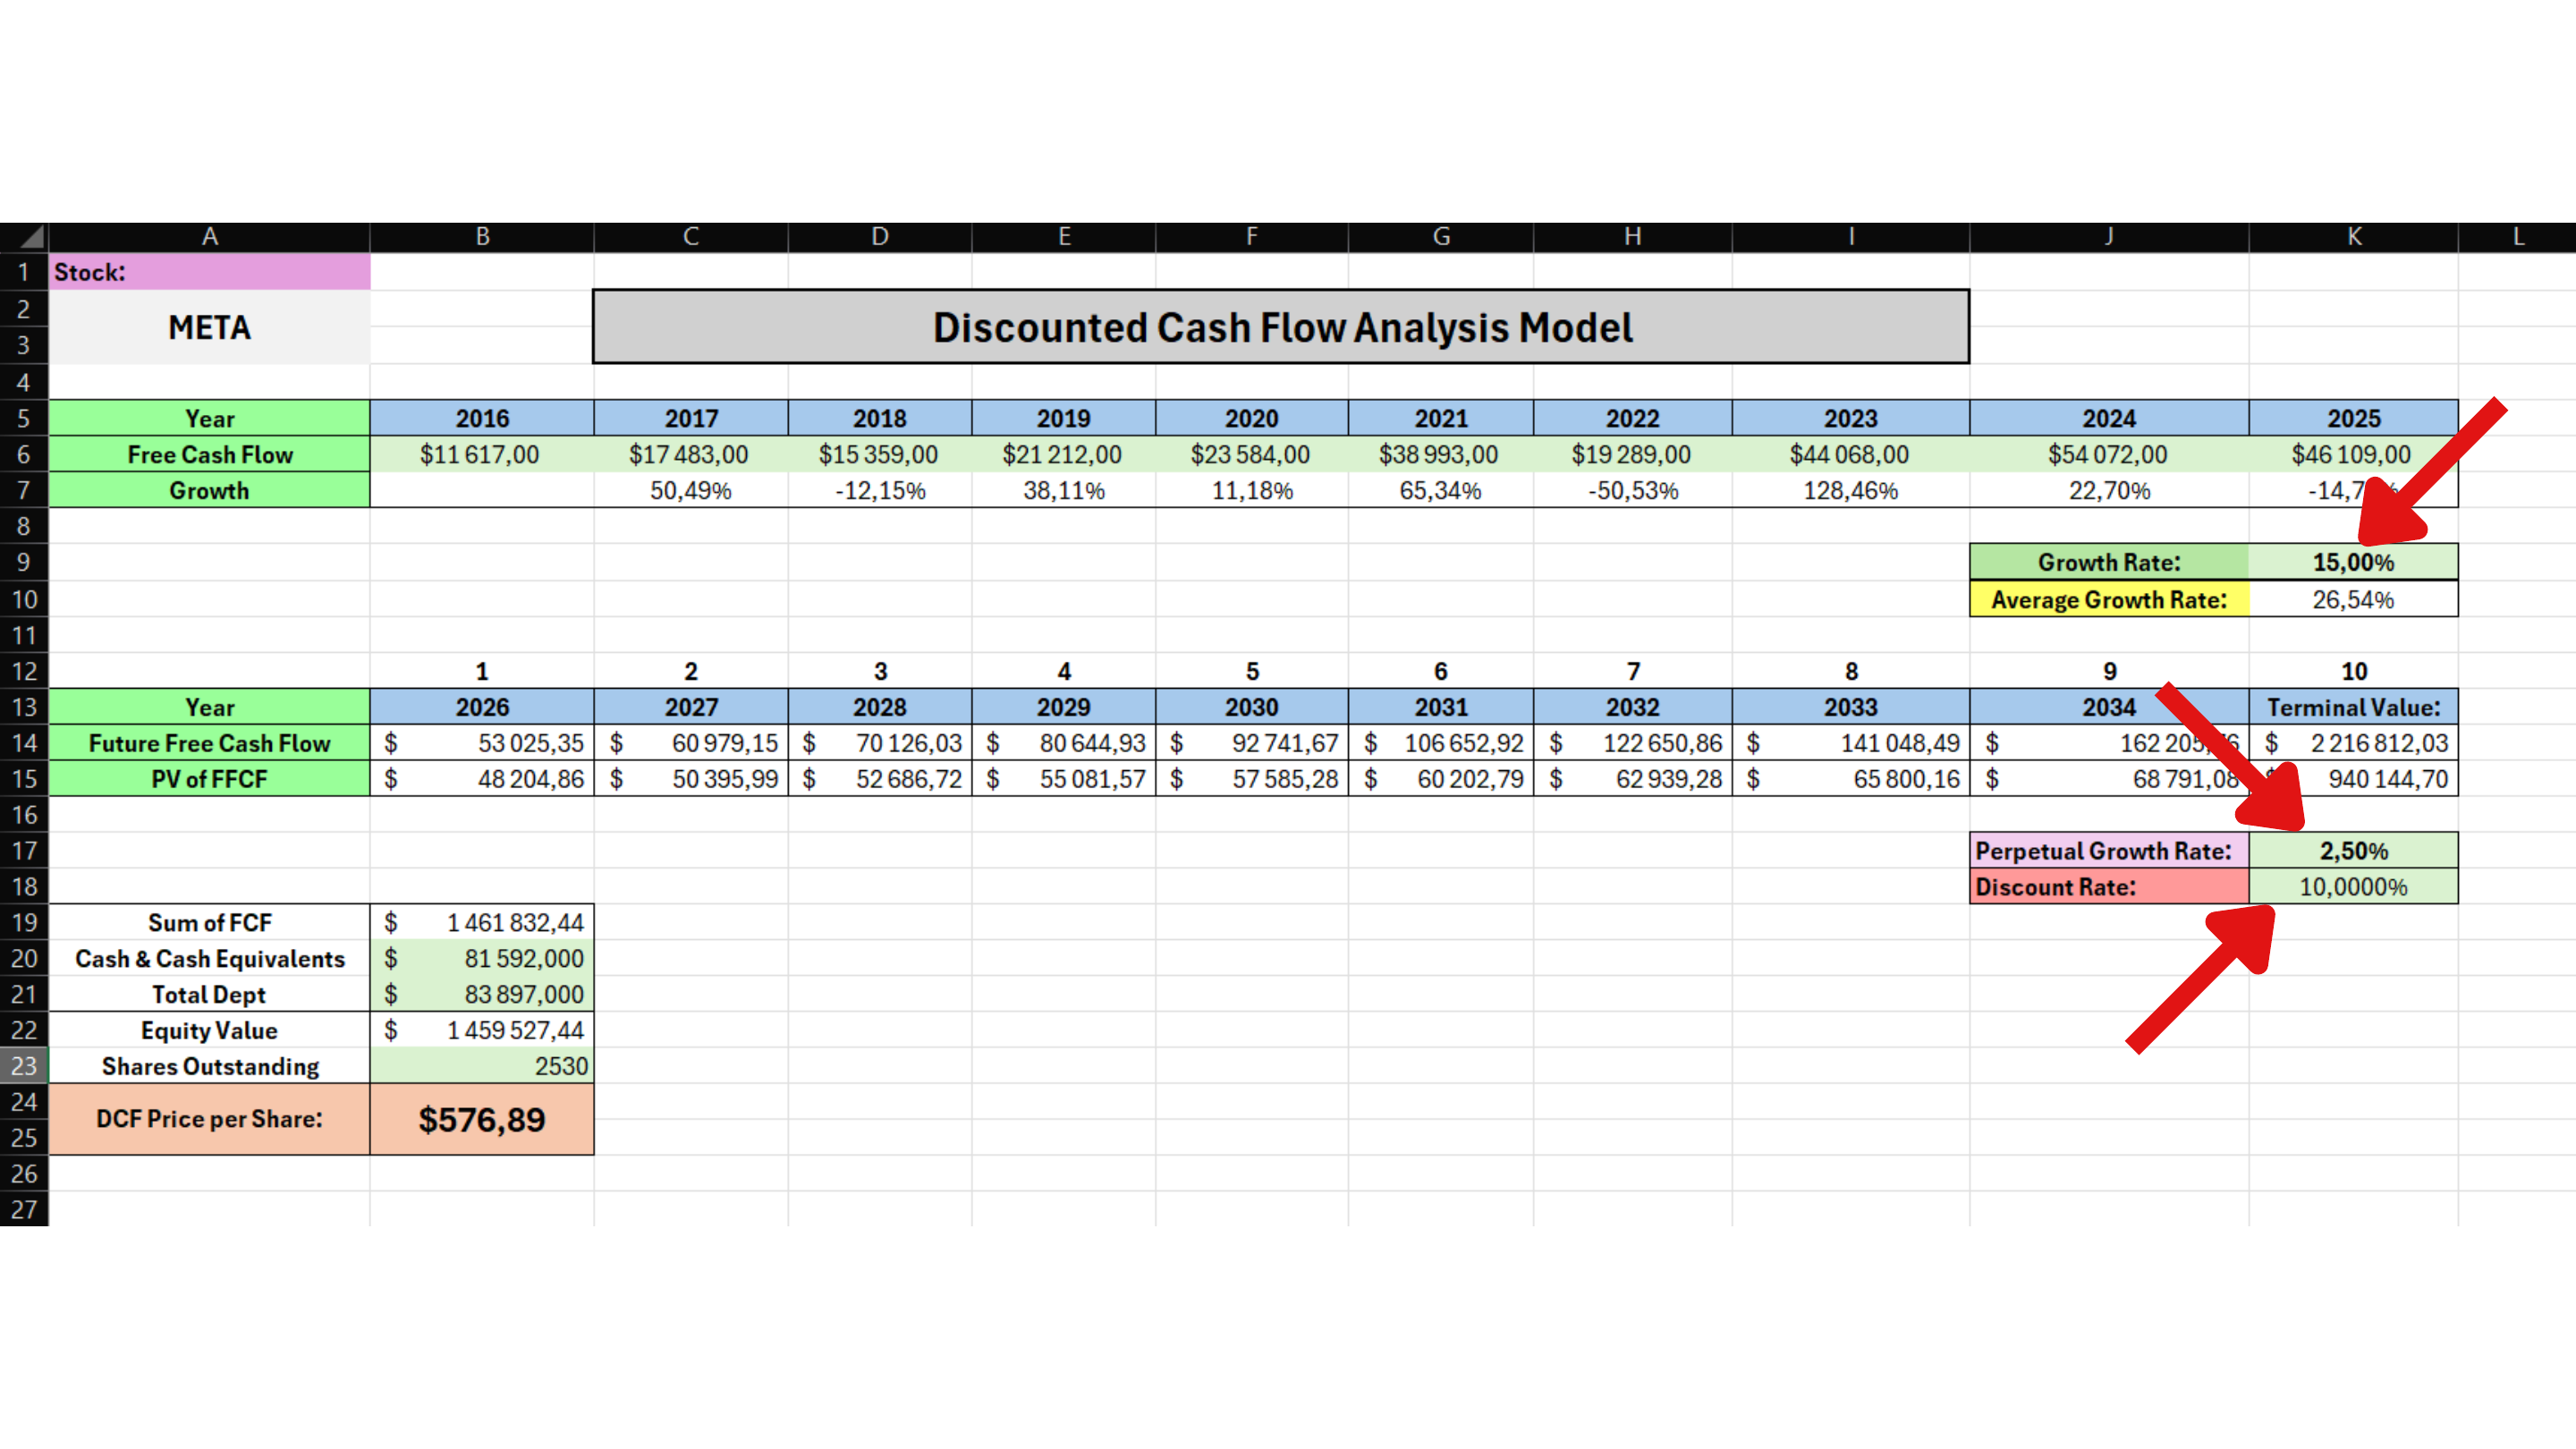
Before you begin the DCF calculation, you need to choose three assumptions the model will use: Growth Rate, Perpetual Growth Rate, and Discount Rate. These assumptions have a major impact on the estimated intrinsic value, so they should not be chosen randomly.
Set:
Growth Rate = 15% / Perpetual Growth Rate = 2.5%
Not sure which values to use? Click here to see an explanation of these three assumptions and how to choose appropriate values.
Calculate the First Free Cash Flow Growth Rate
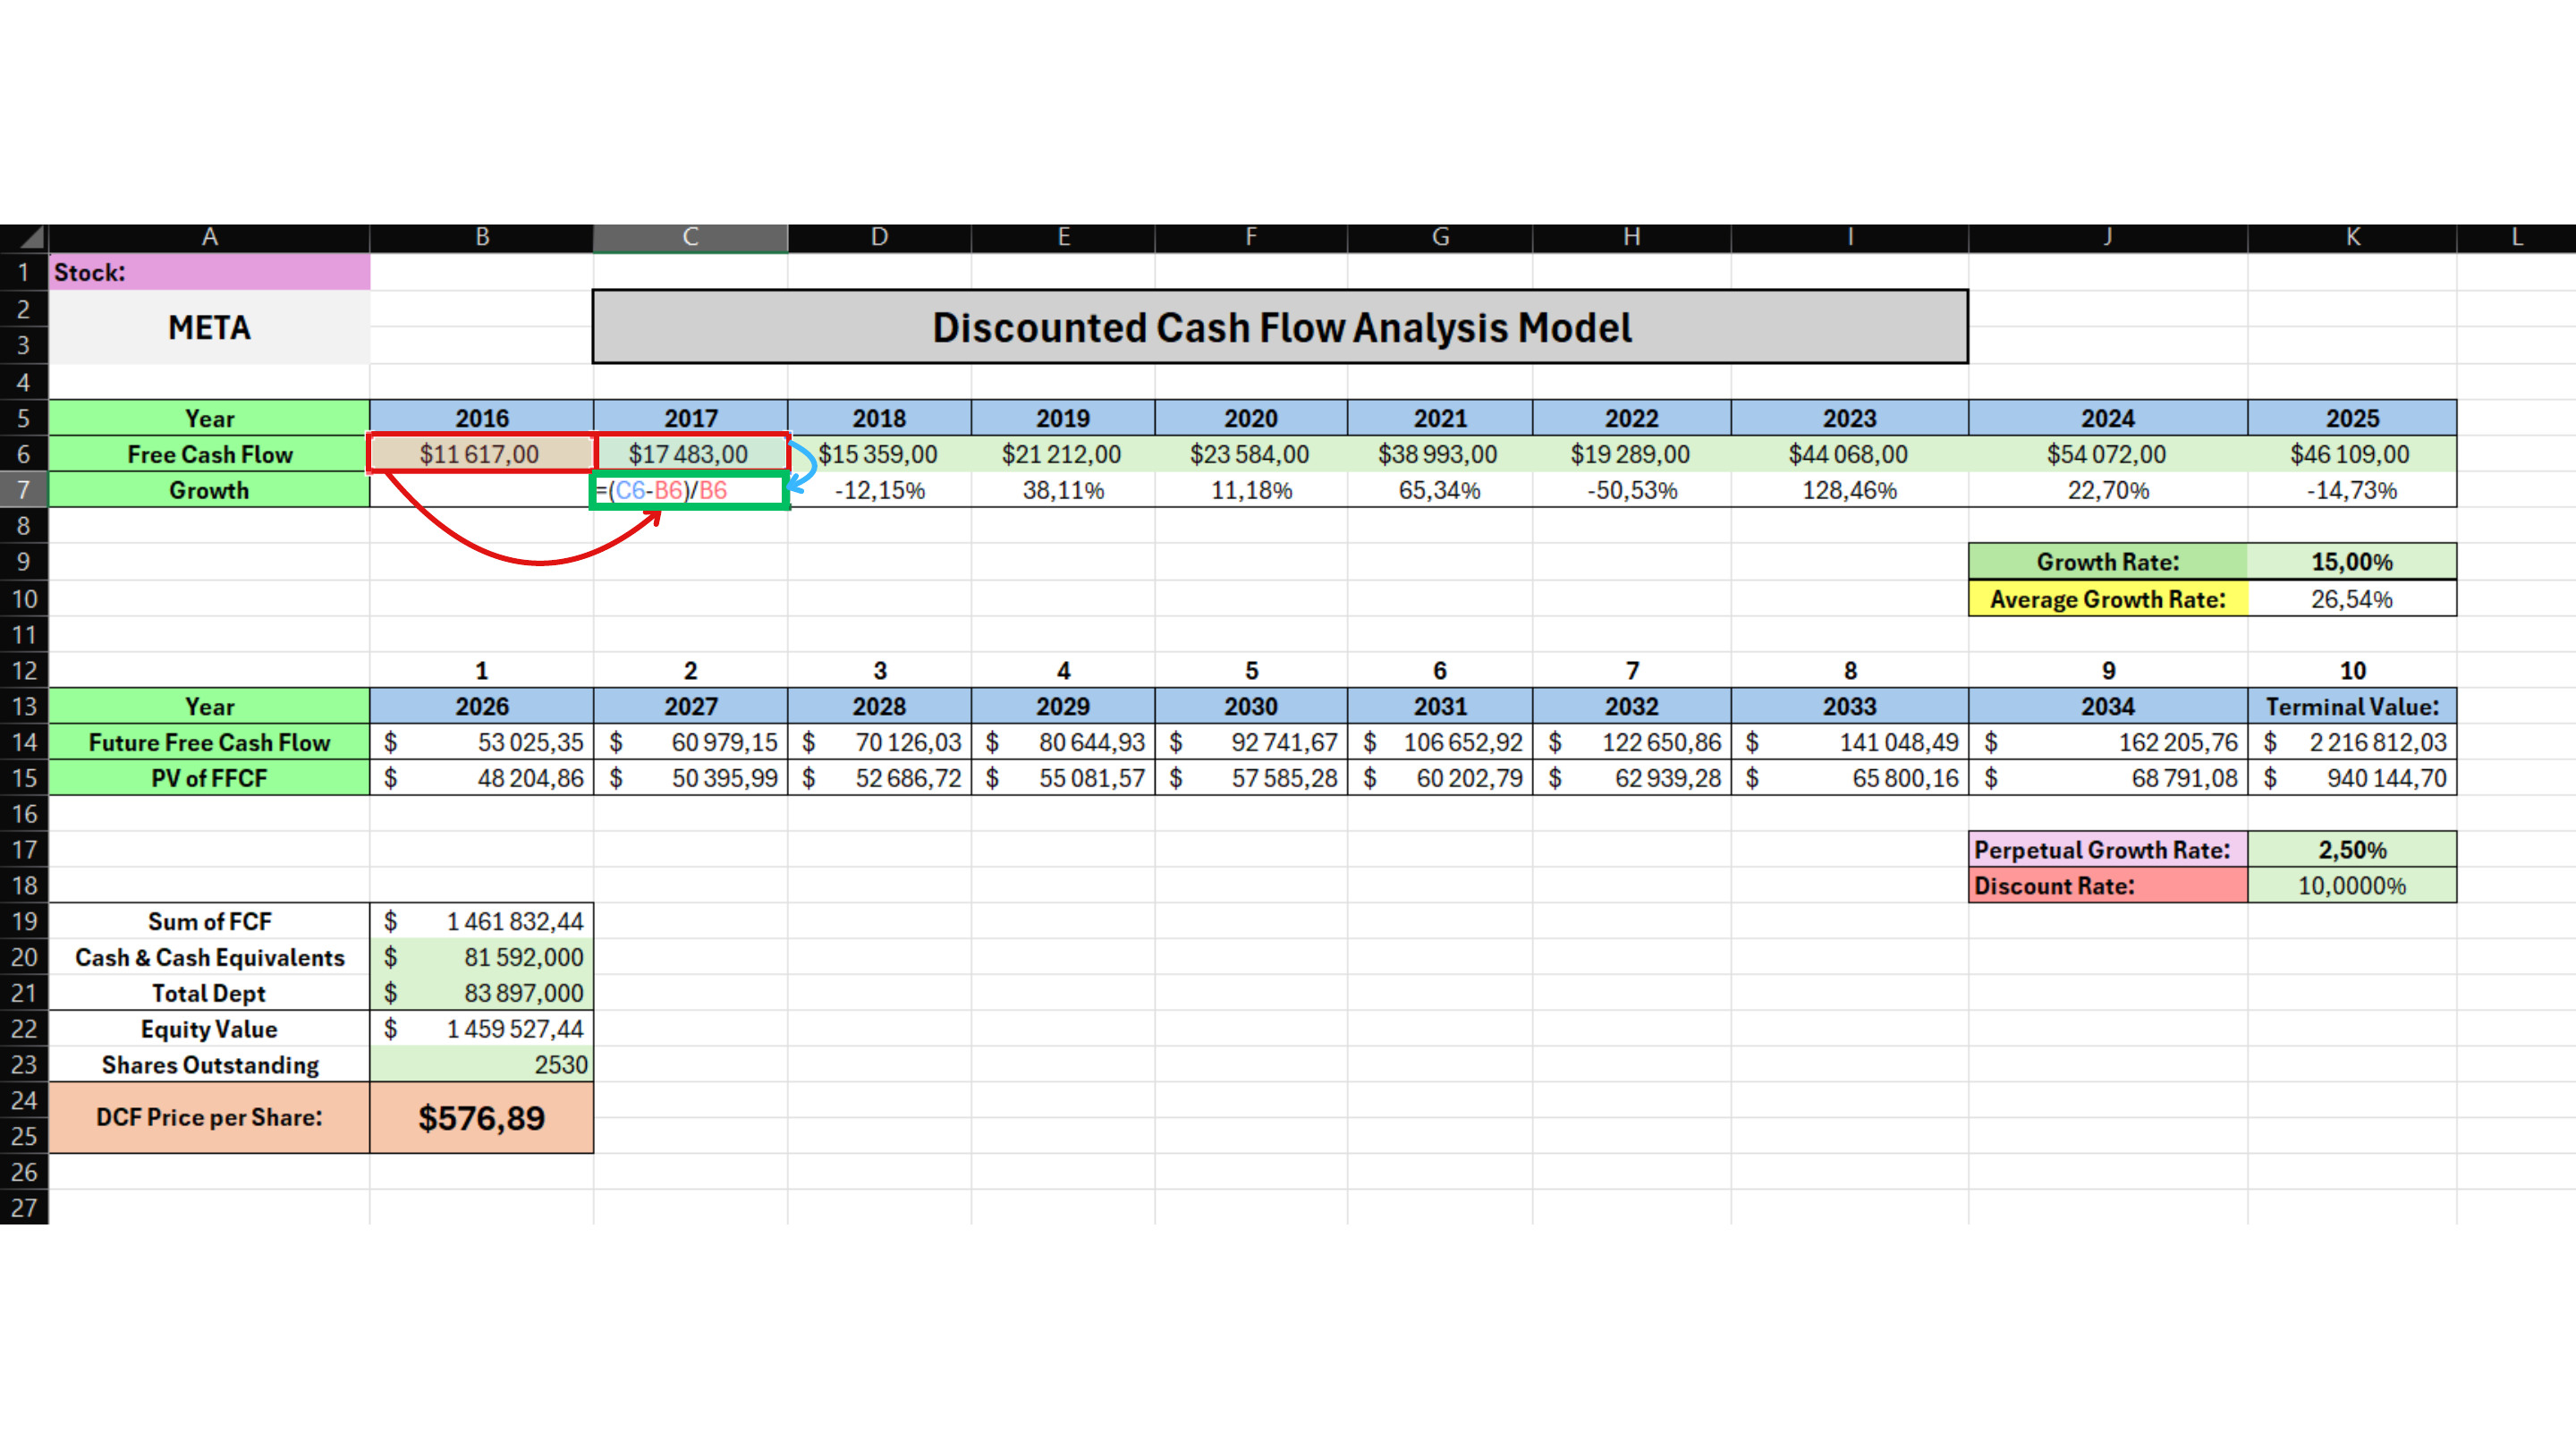
Start by comparing Free Cash Flow from two consecutive years. In our example, we calculate how much FCF changed between 2016 and 2017.
Calculation:
(FCF 2017 - FCF 2016) / FCF 2016 / (17,483 - 11,617) / 11,617 = 50.49%
Calculate Growth Through the Last Historical Year
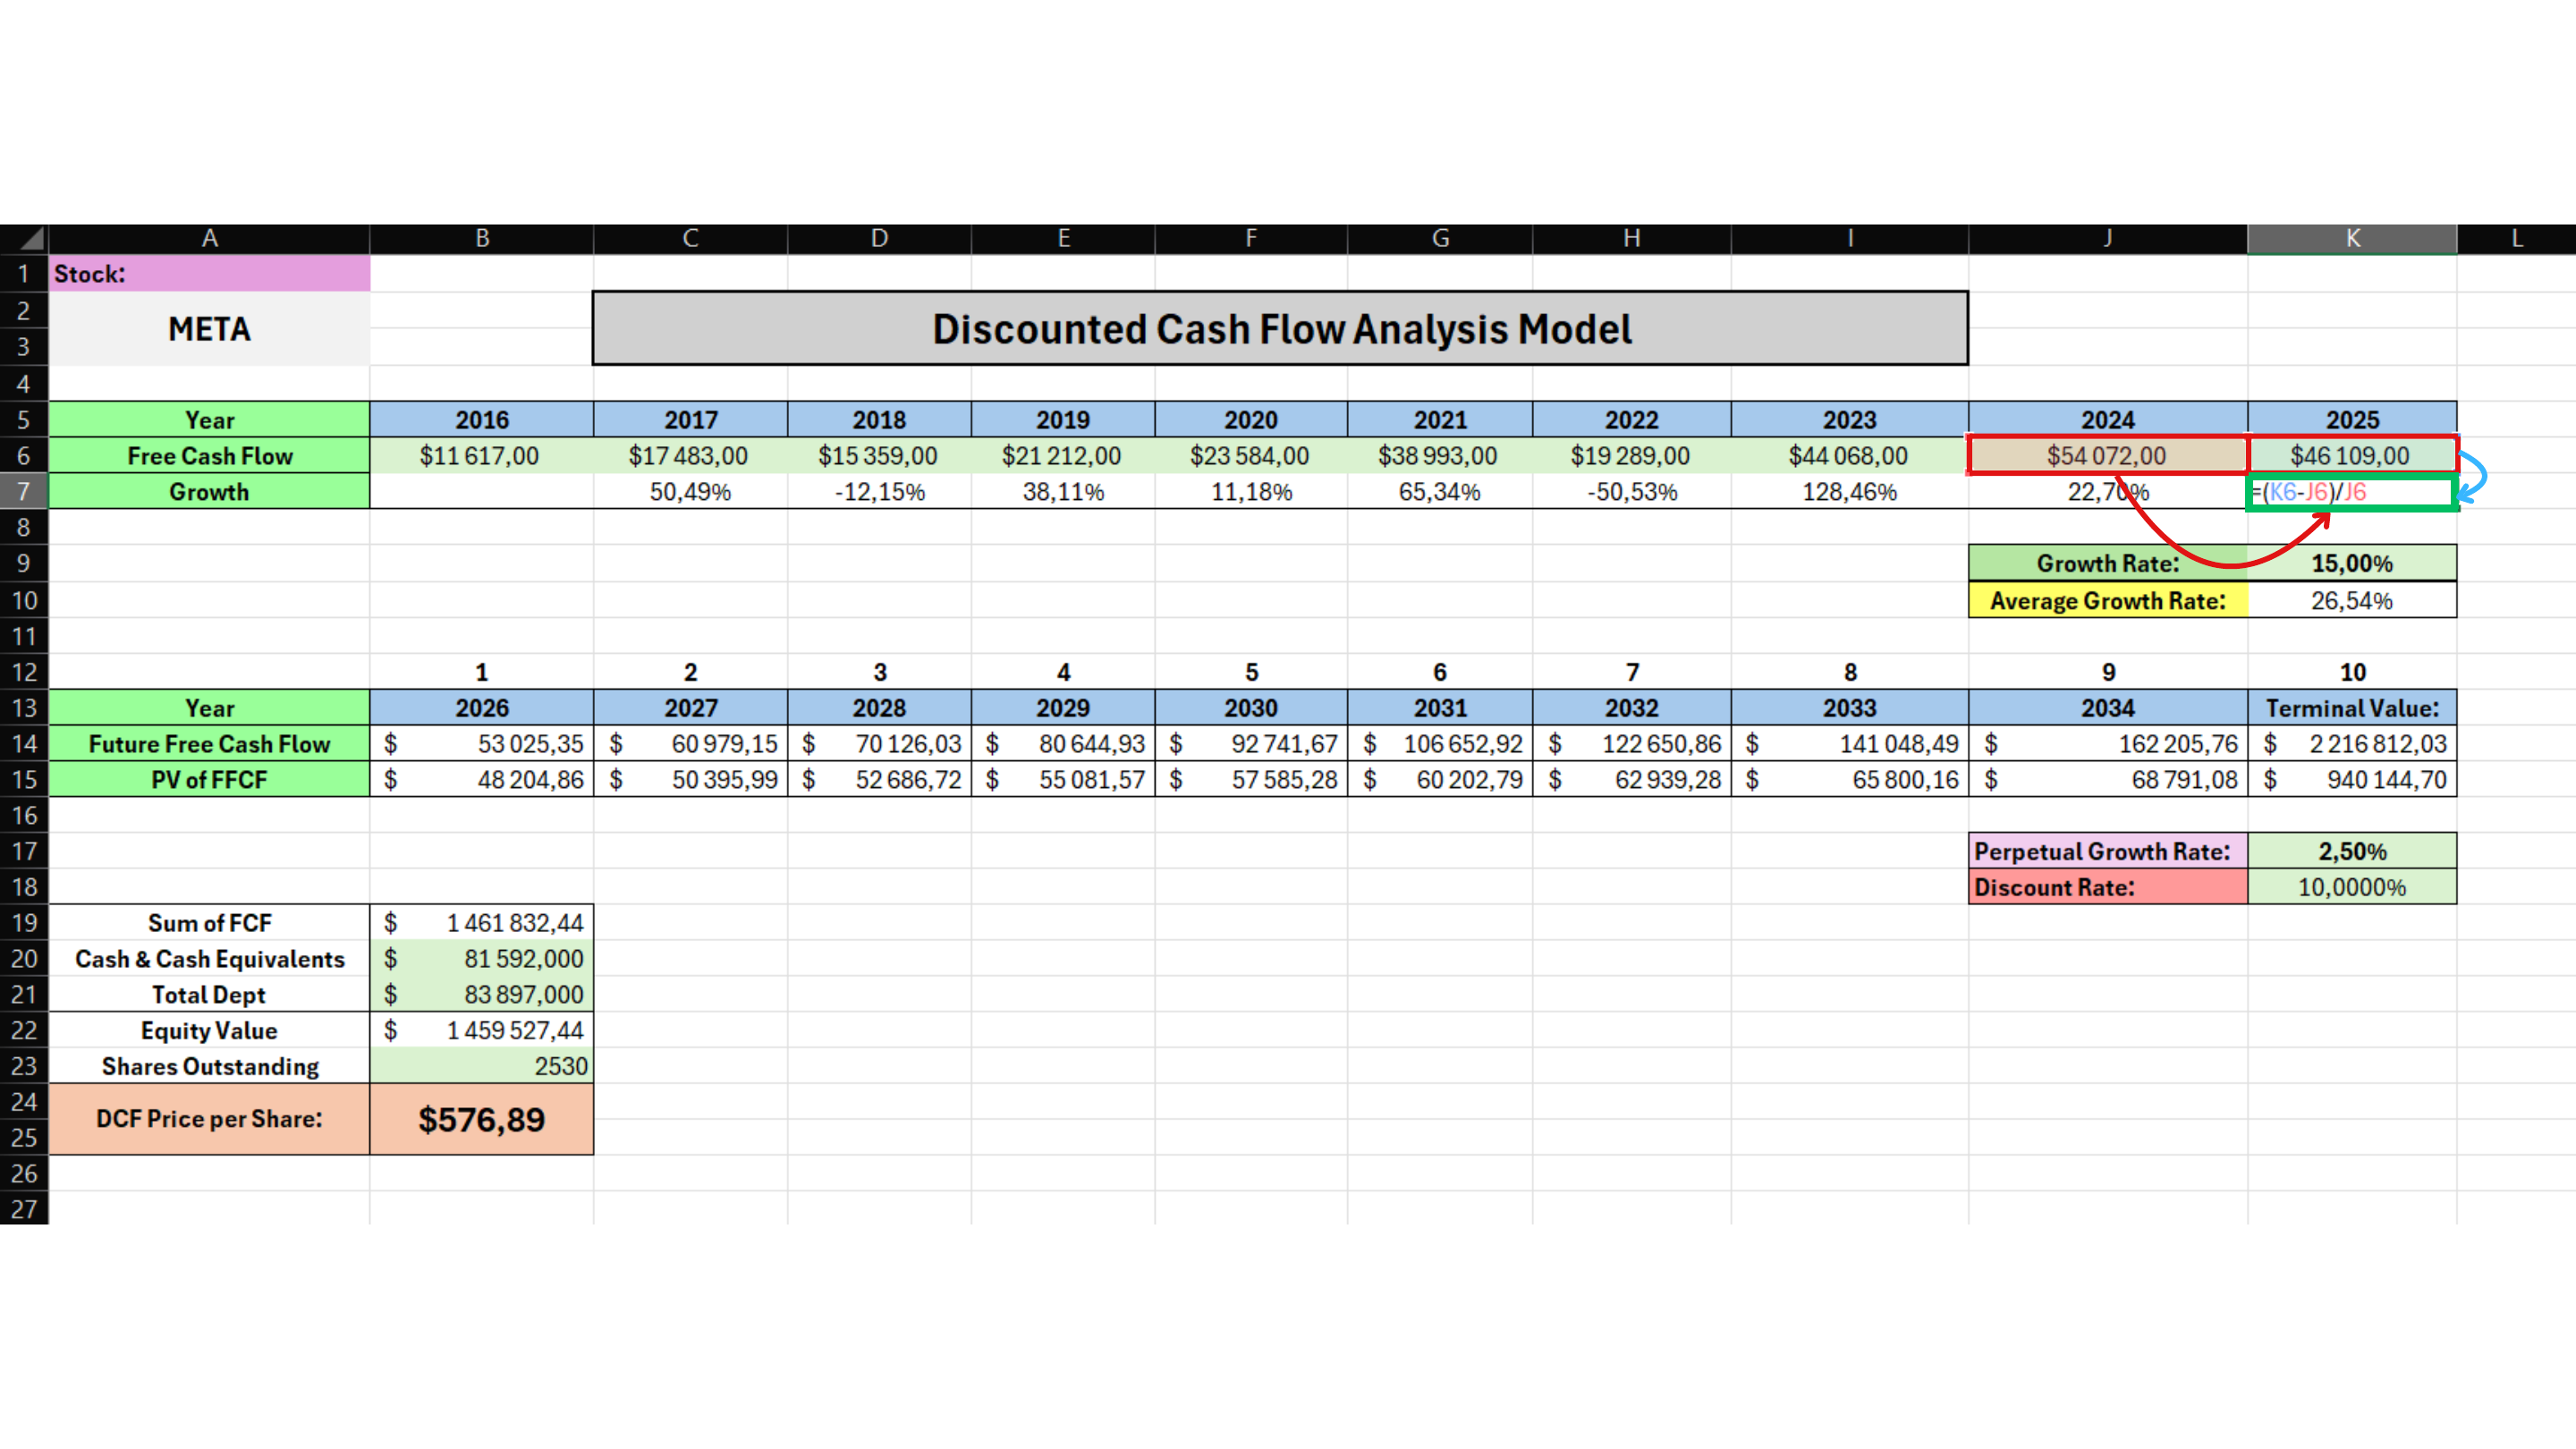
Now repeat the same calculation year by year until you reach the latest available year. Always take the current year's FCF, subtract the previous year's FCF, and divide the result by the previous year's FCF.
Calculation:
(FCF current year - FCF previous year) / FCF previous year
Continue using the same method through 2025.
Calculate the Average Historical Growth Rate
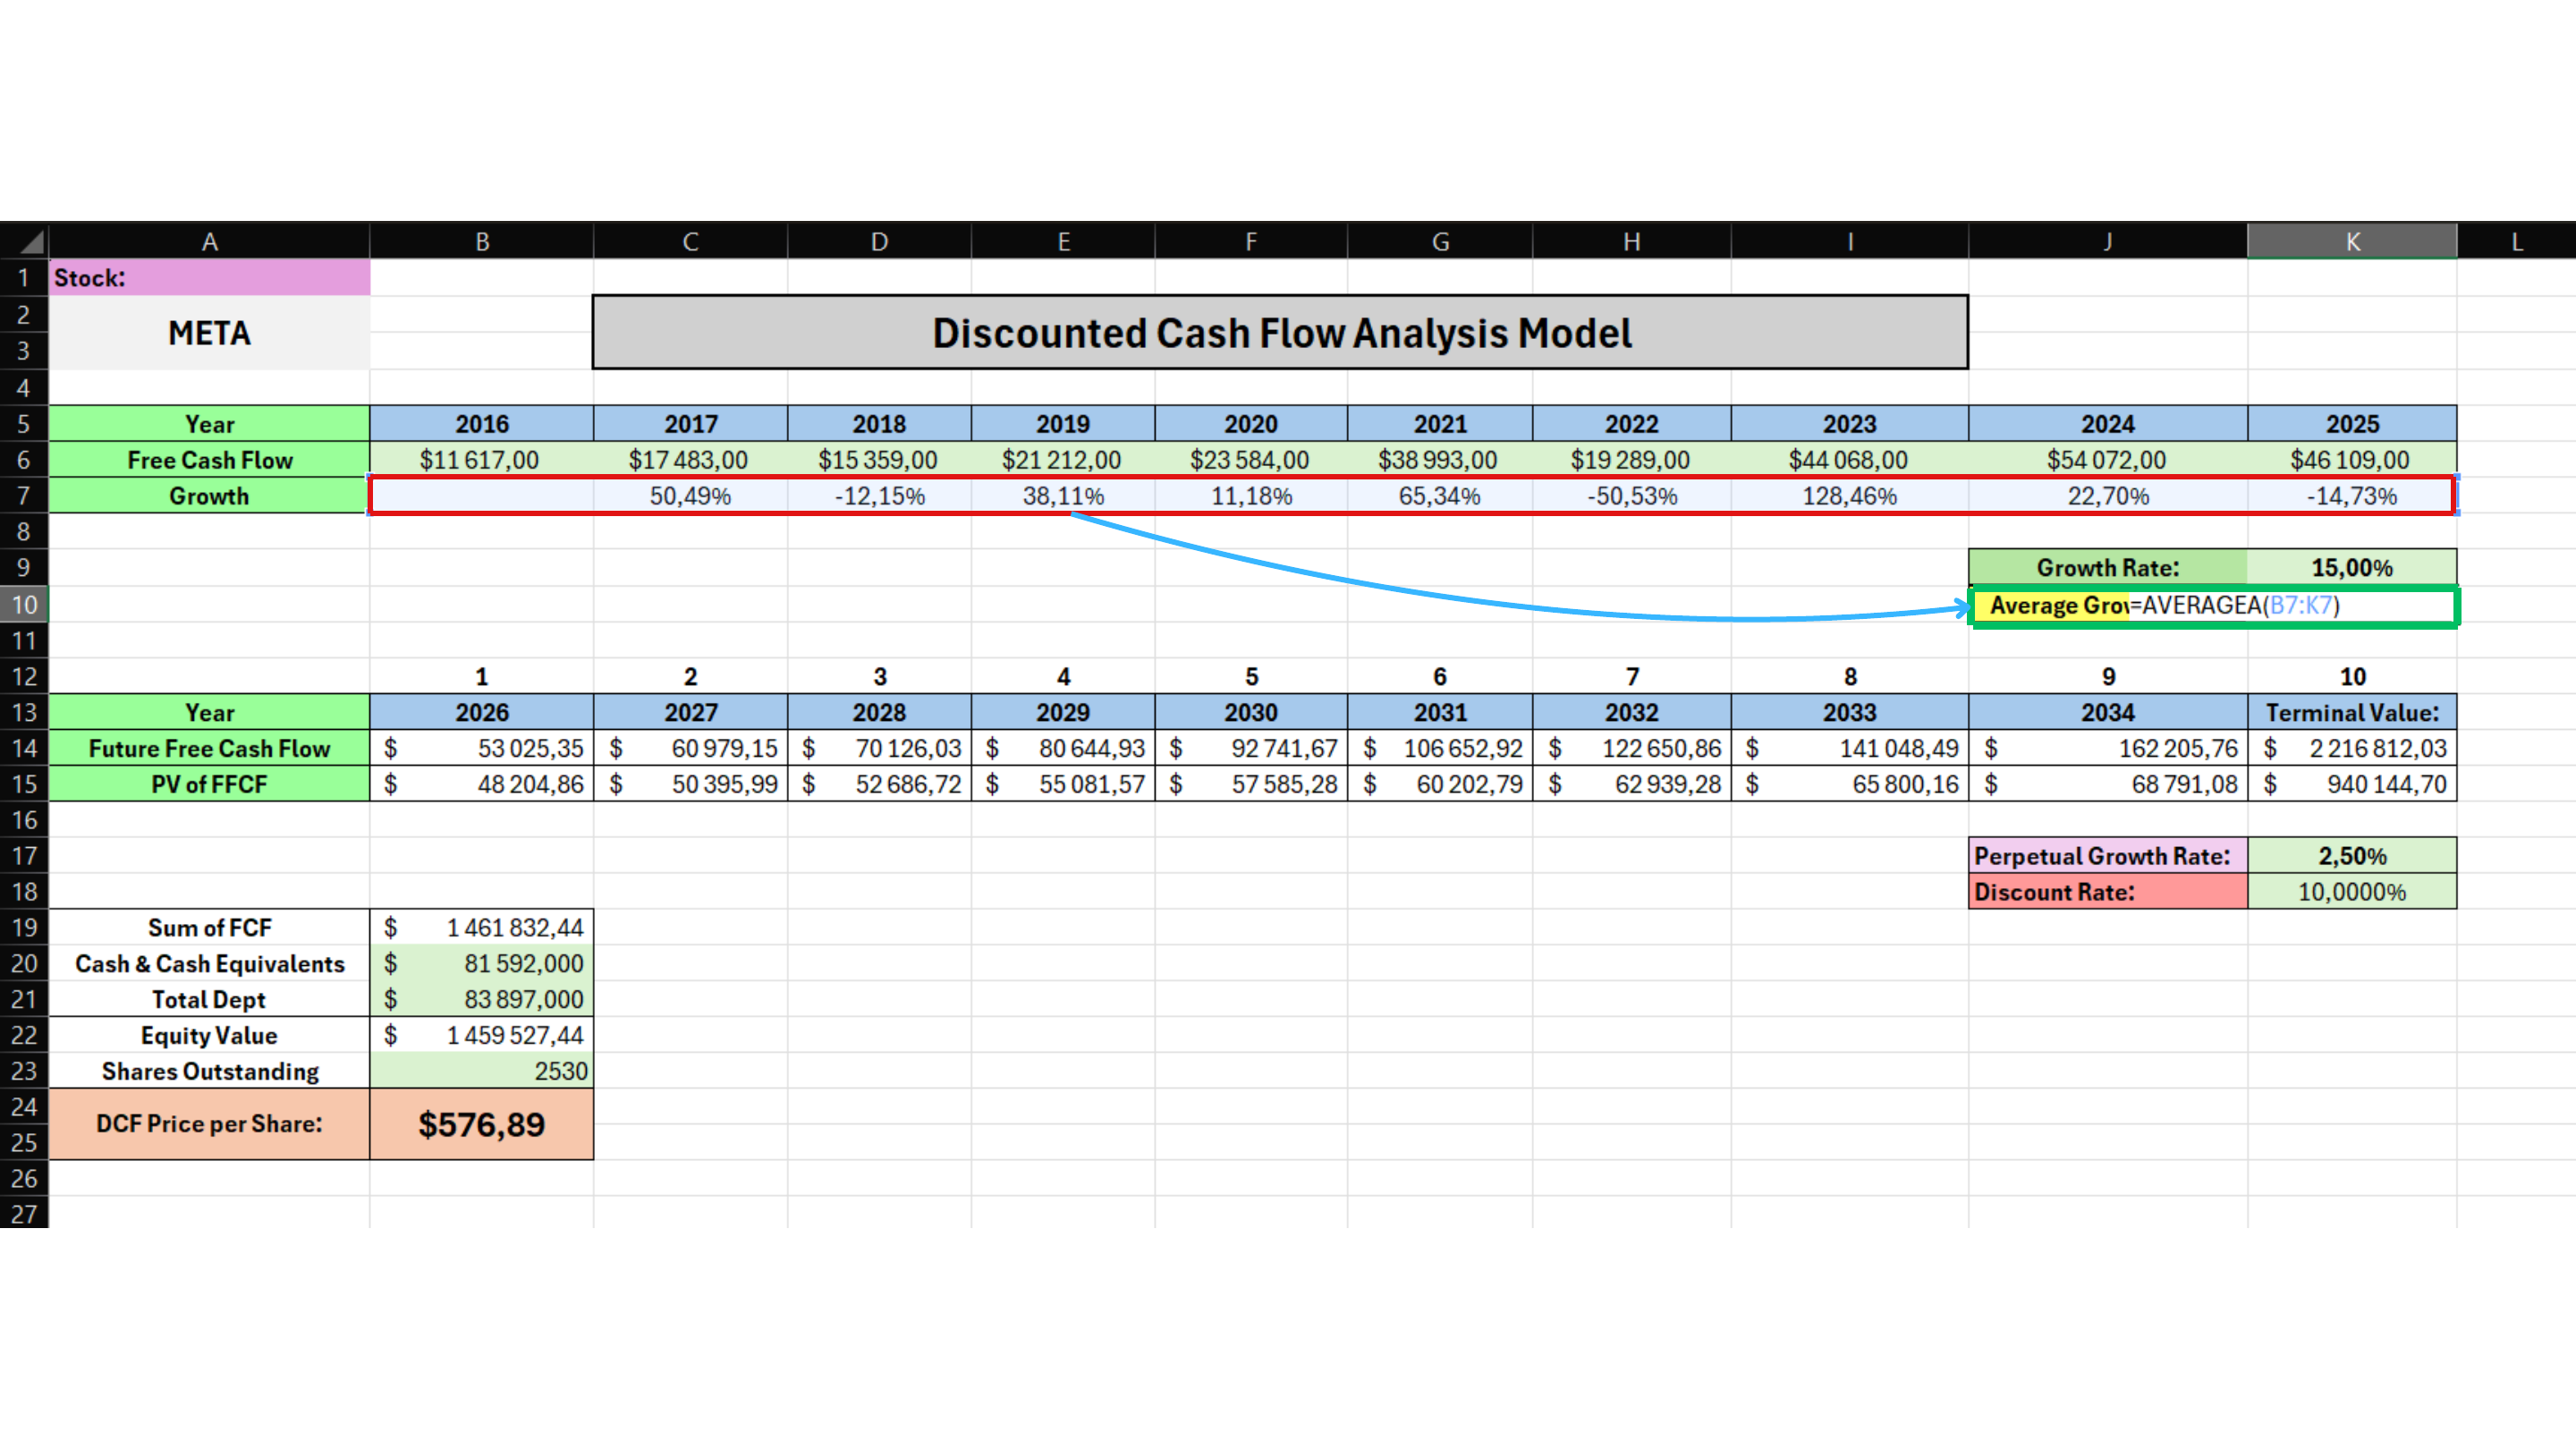
Once all year-over-year growth rates are calculated, select the entire Growth row and calculate the average. In our example, the average historical growth rate is 26.54%.
Calculation:
=AVERAGEA(B7:K7) / Result: 26.54%
Use this number mainly as a reference when choosing your own future Growth Rate.
Calculate the First Future Free Cash Flow
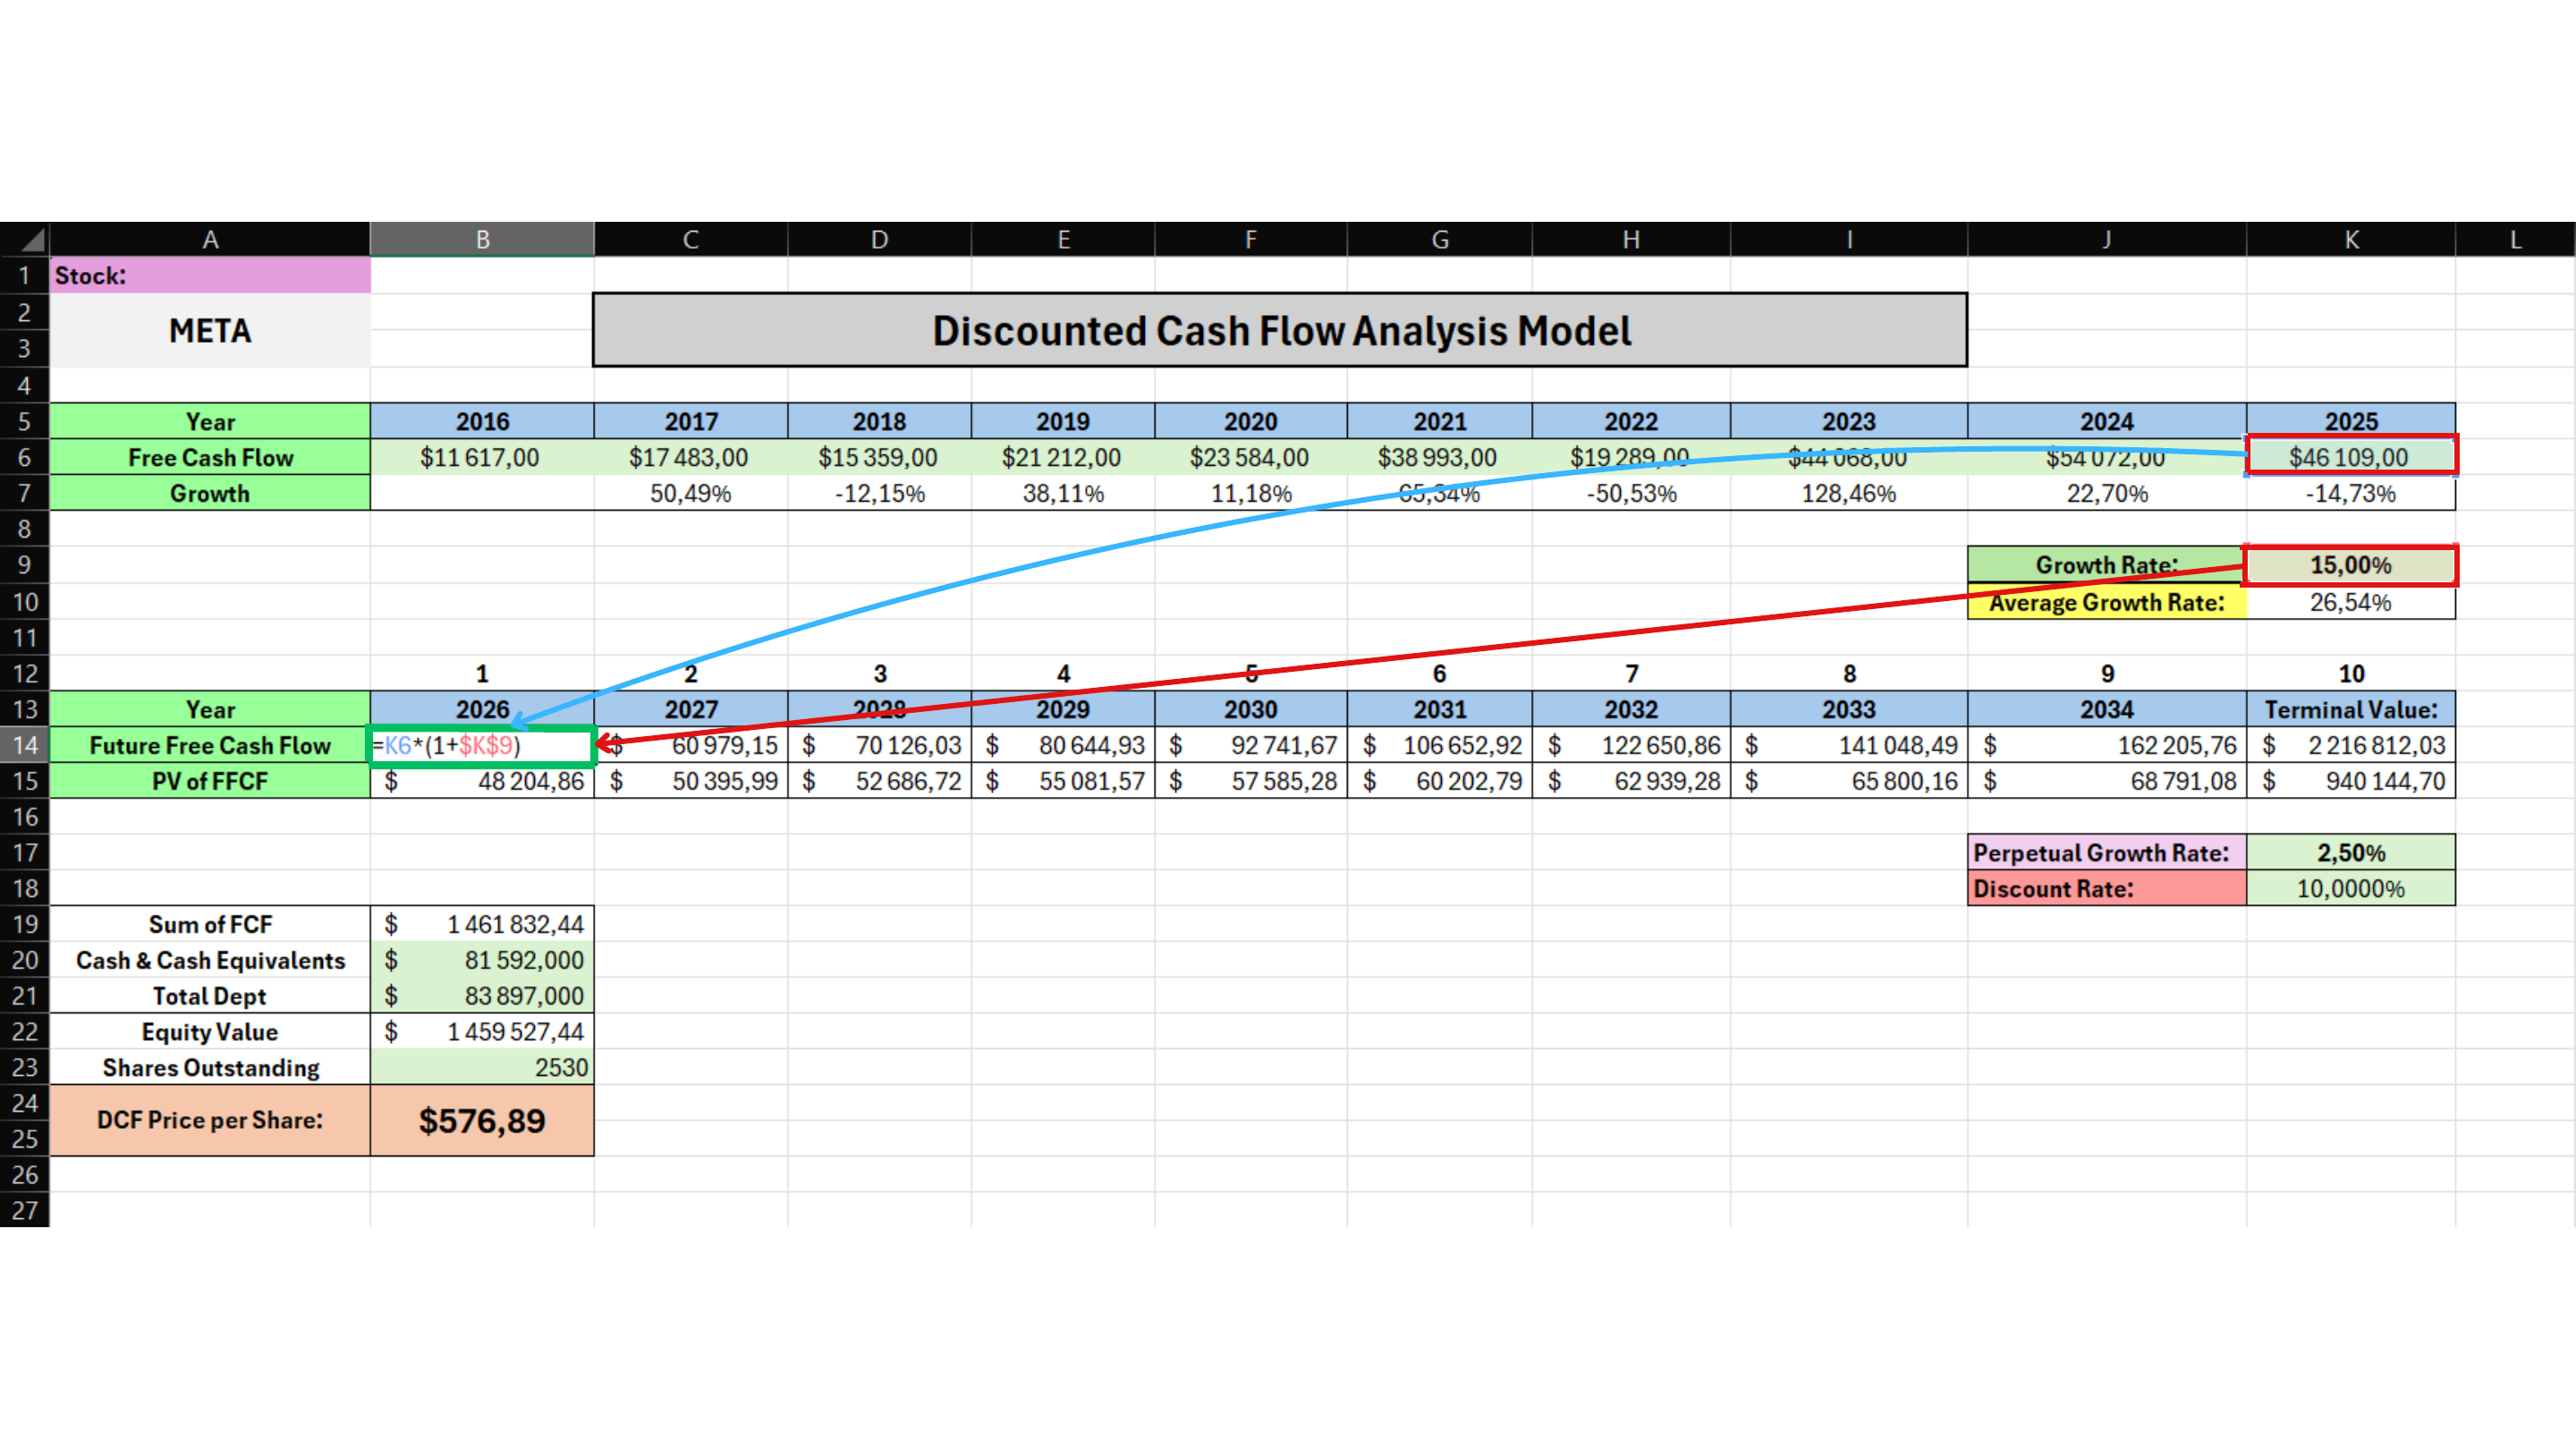
Now we begin estimating the future. Take the latest known FCF from 2025 and increase it by your chosen Growth Rate, which is 15% in our example.
Calculation:
FCF 2025 x (1 + Growth Rate) / 46,109 x (1 + 15%) = 53,025.35
This gives you the estimated FCF for 2026.
Project Future FCF Through 2034
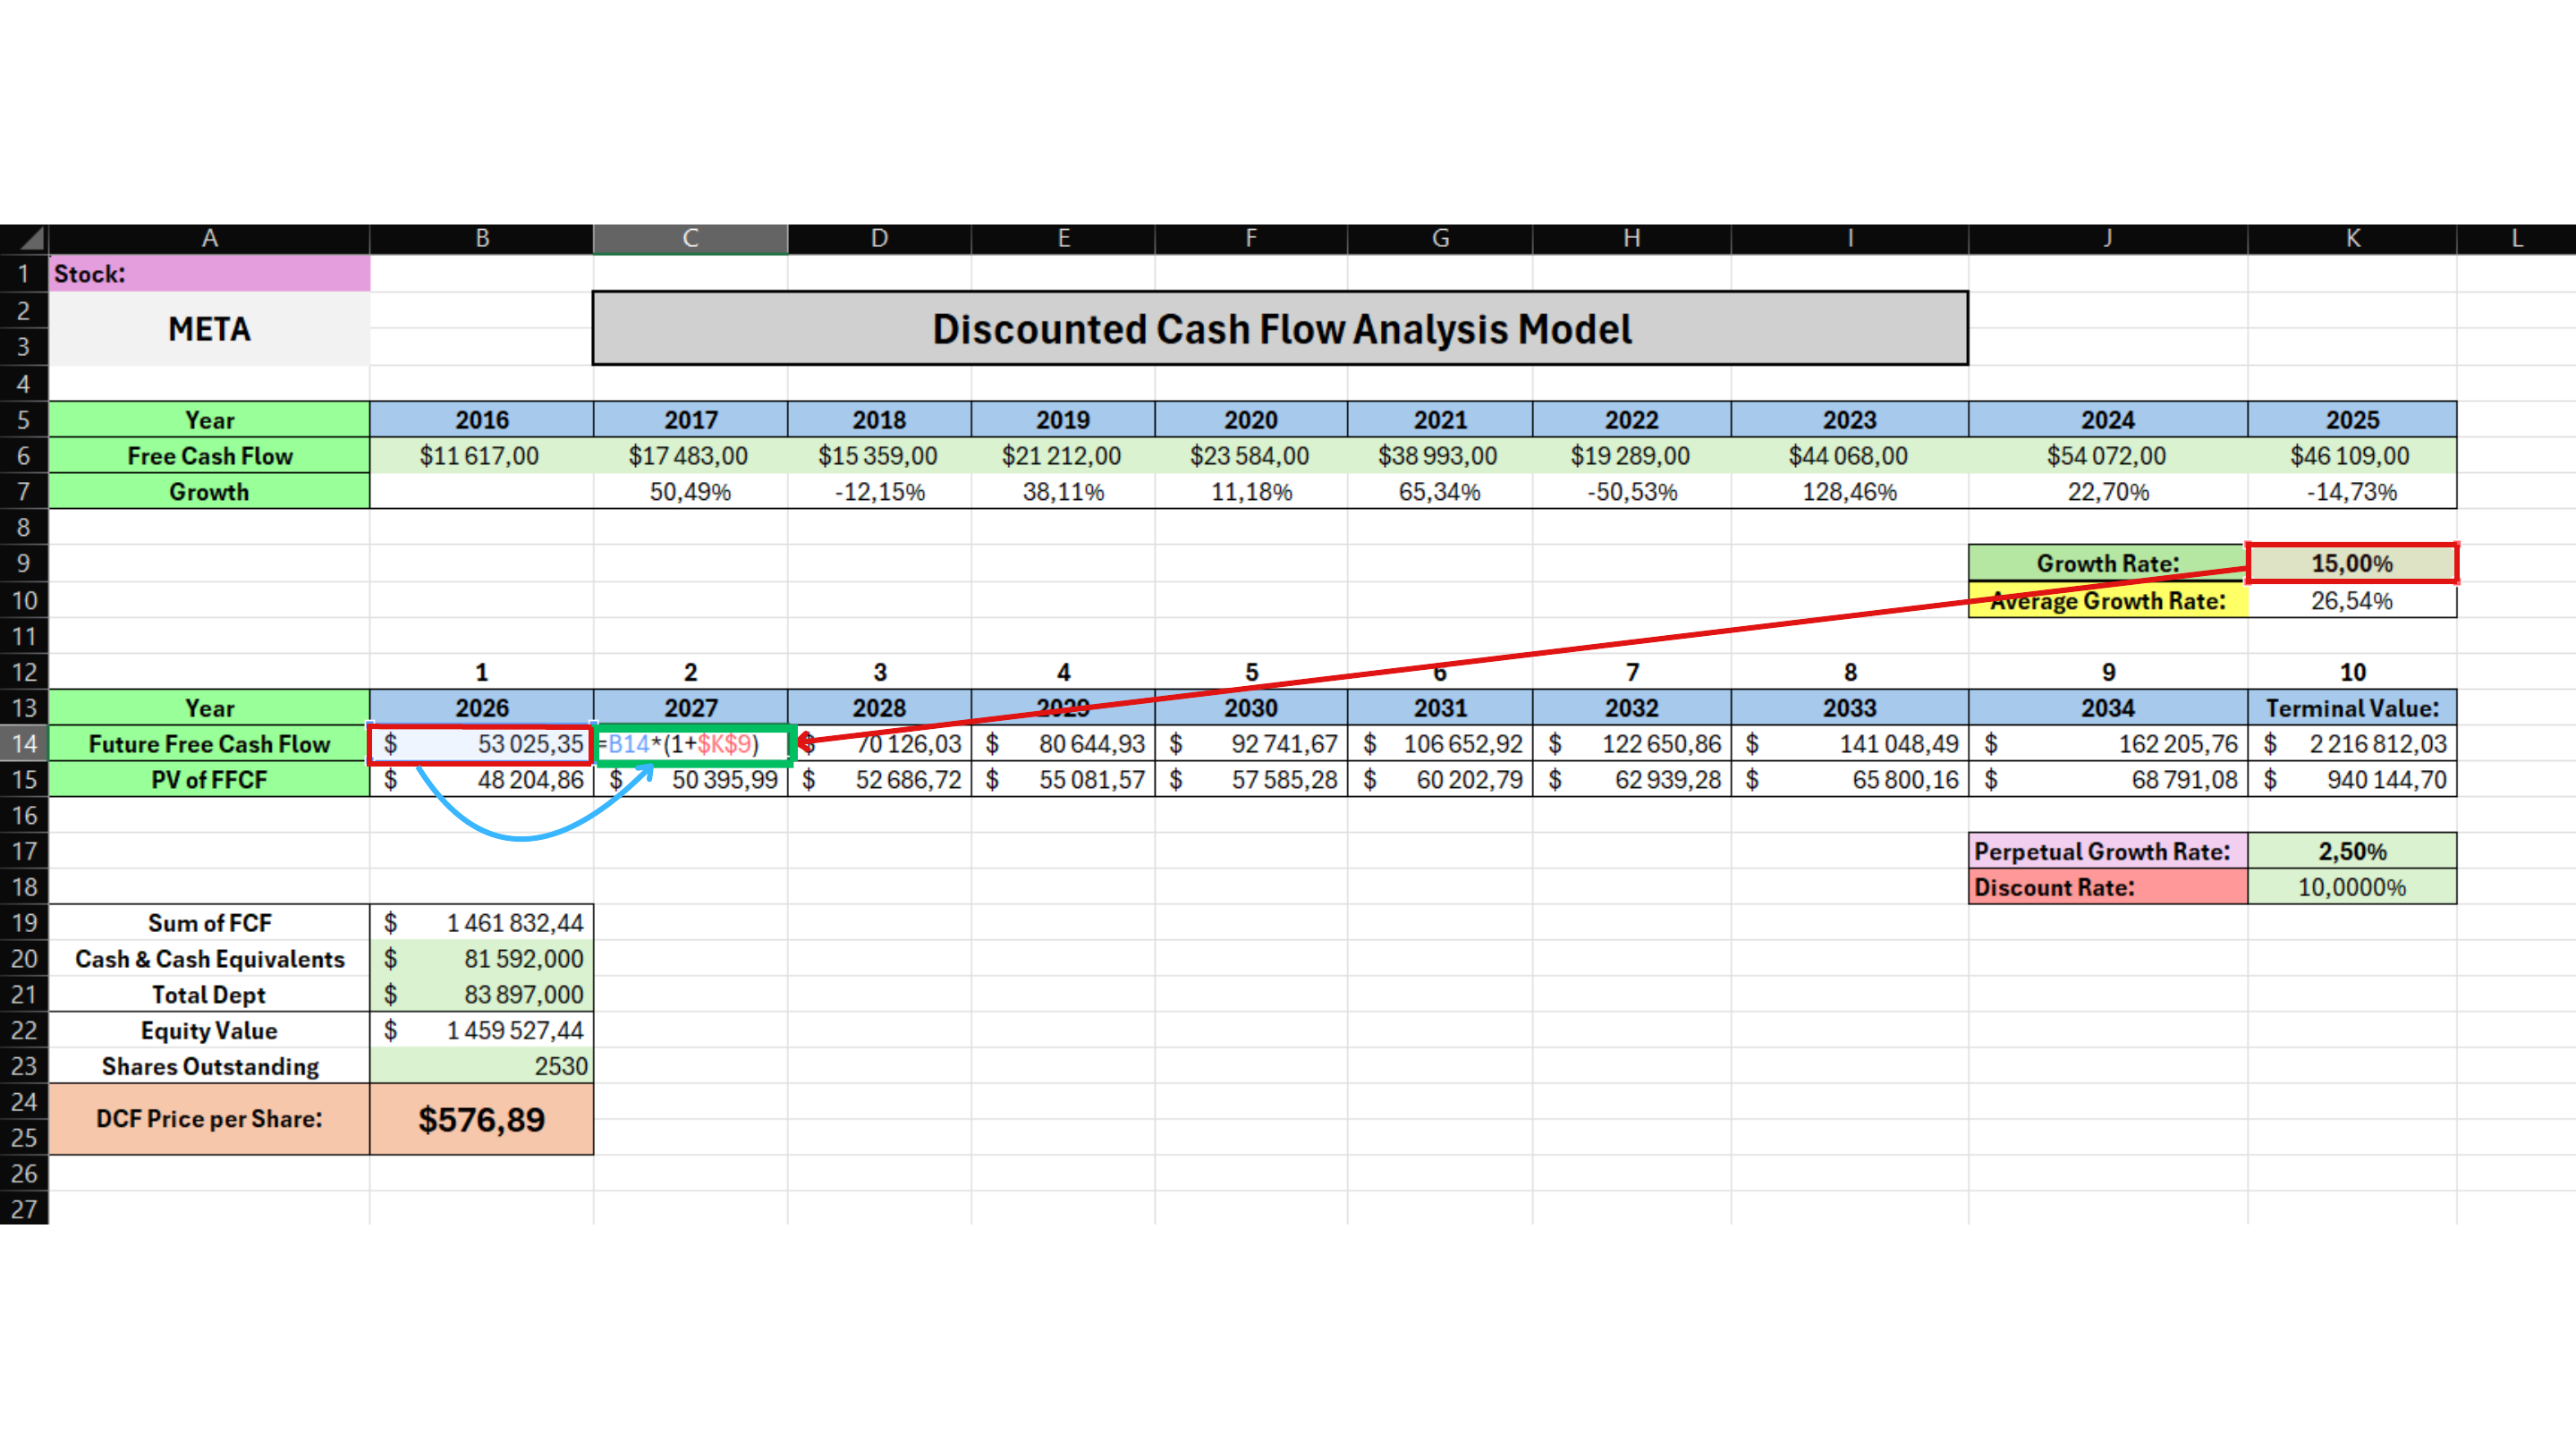
For the next year, use the previous Future Free Cash Flow and increase it again by the same Growth Rate. Repeat this process for every year through 2034.
Calculation:
FCF next year = FCF previous year x (1 + Growth Rate) / 53,025.35 x 1.15 = 60,979.15
Then continue in the same way: 2027 -> 2028 -> 2029 -> ... -> 2034.
Calculate Terminal Value
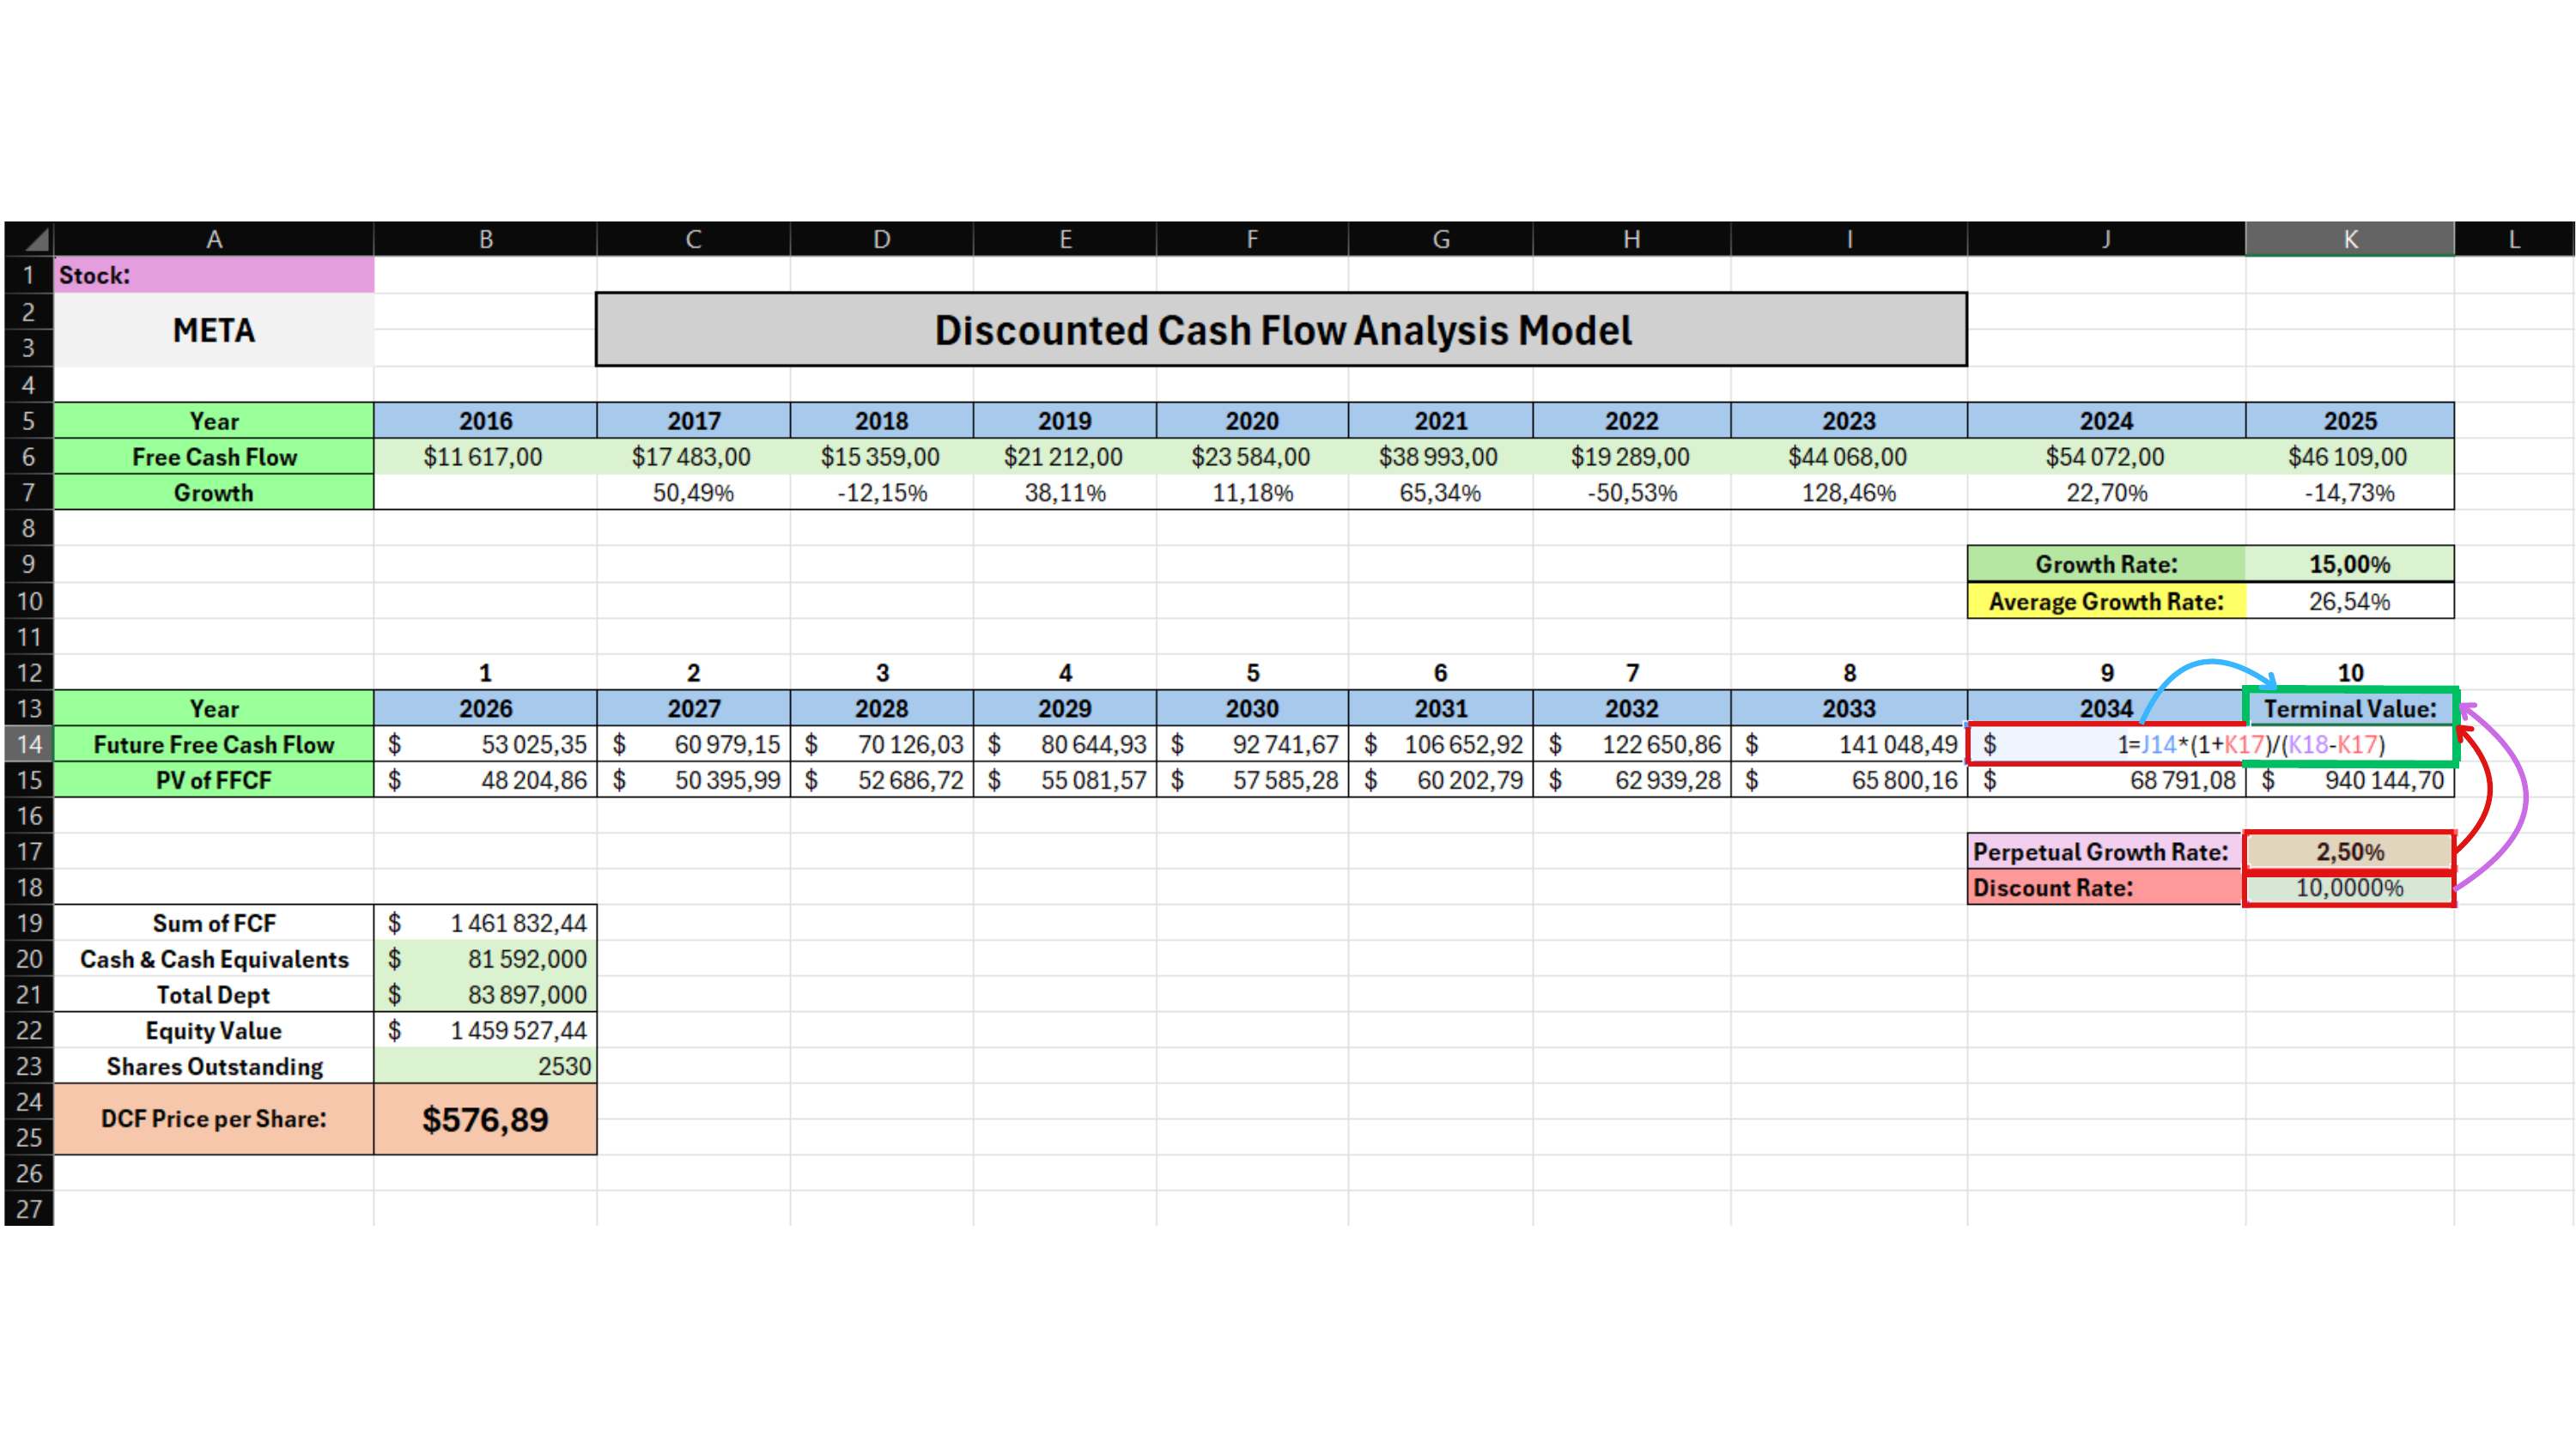
At this point, we are no longer calculating another regular year of Future Free Cash Flow. Instead, we calculate Terminal Value, which estimates the value of the business after our detailed forecast period ends in 2034.
Calculation:
Terminal Value = FCF 2034 x (1 + Perpetual Growth Rate) / (Discount Rate - Perpetual Growth Rate) / 162,205.76 x (1 + 2.5%) / (10% - 2.5%) = 2,216,812.03
Use the final Future FCF, the Perpetual Growth Rate, and the Discount Rate.
Convert the First Future FCF to Present Value
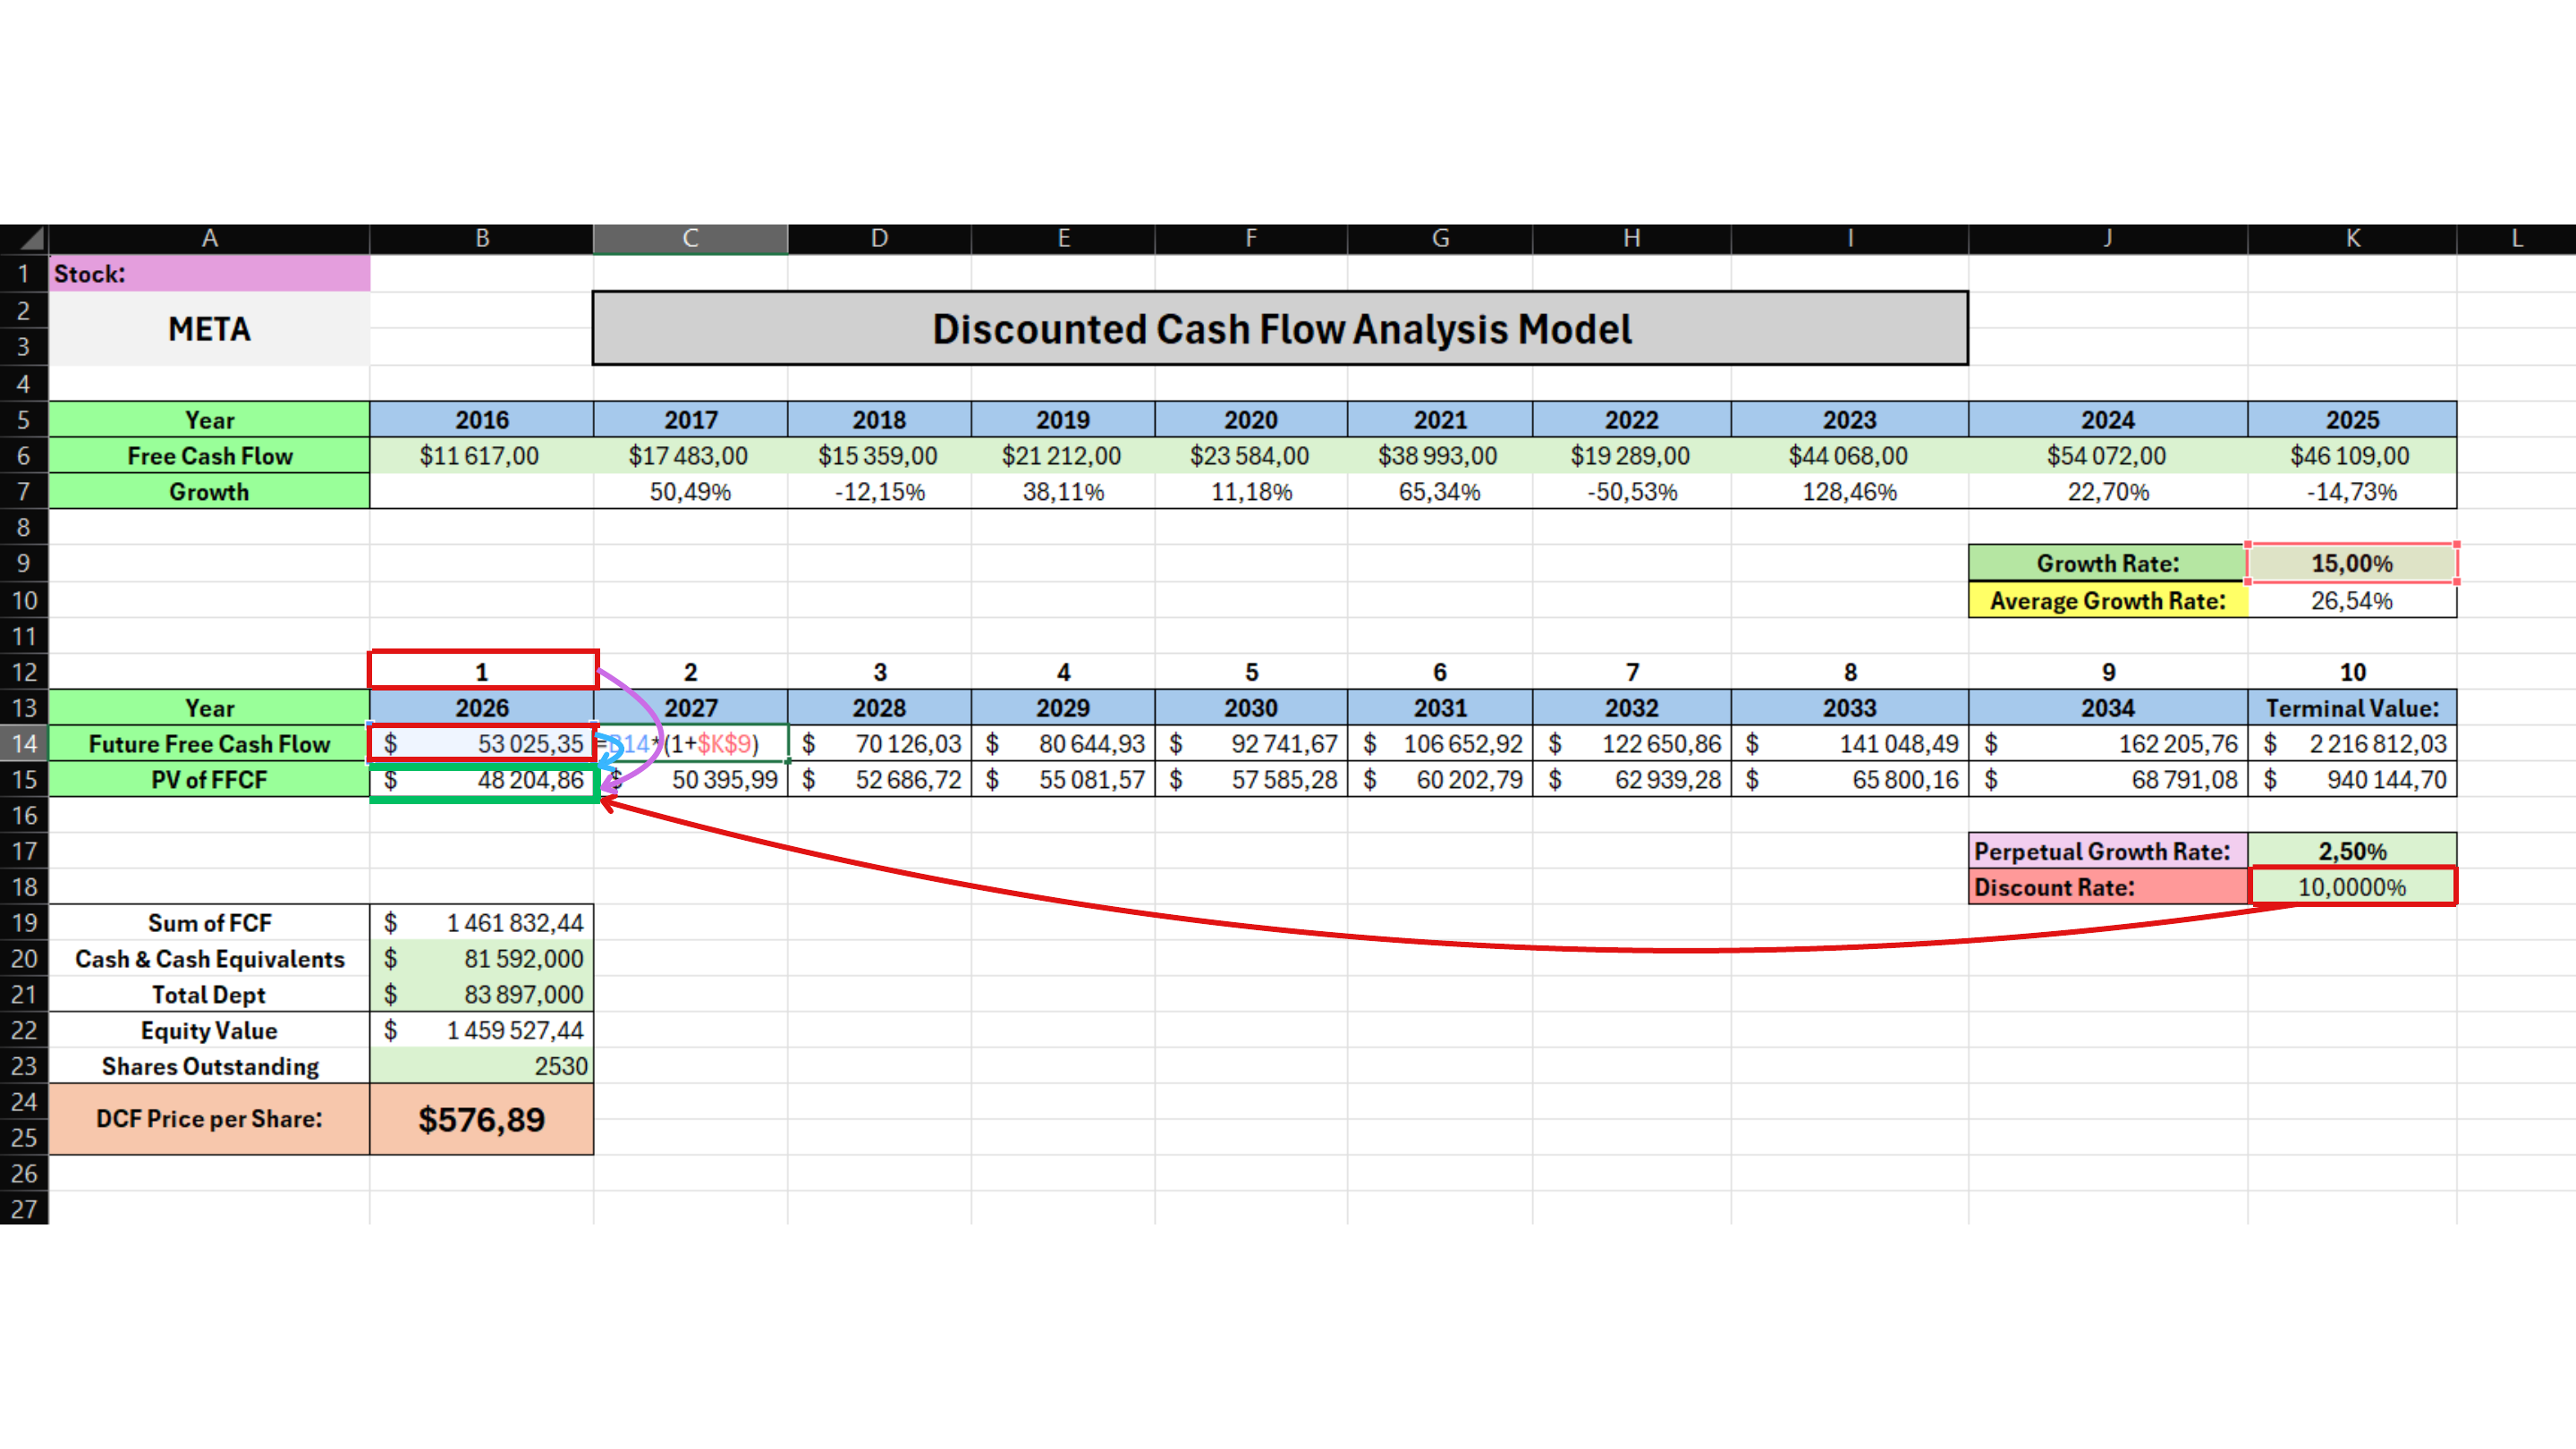
Money received in the future is not worth the same as money today, so Future Free Cash Flow must be discounted using the Discount Rate. We begin with the first forecast year, 2026.
Calculation:
PV of FCF = Future FCF / (1 + Discount Rate)^number of years / 53,025.35 / (1 + 10%)^1 = 48,204.86
Calculate Present Value Through 2034
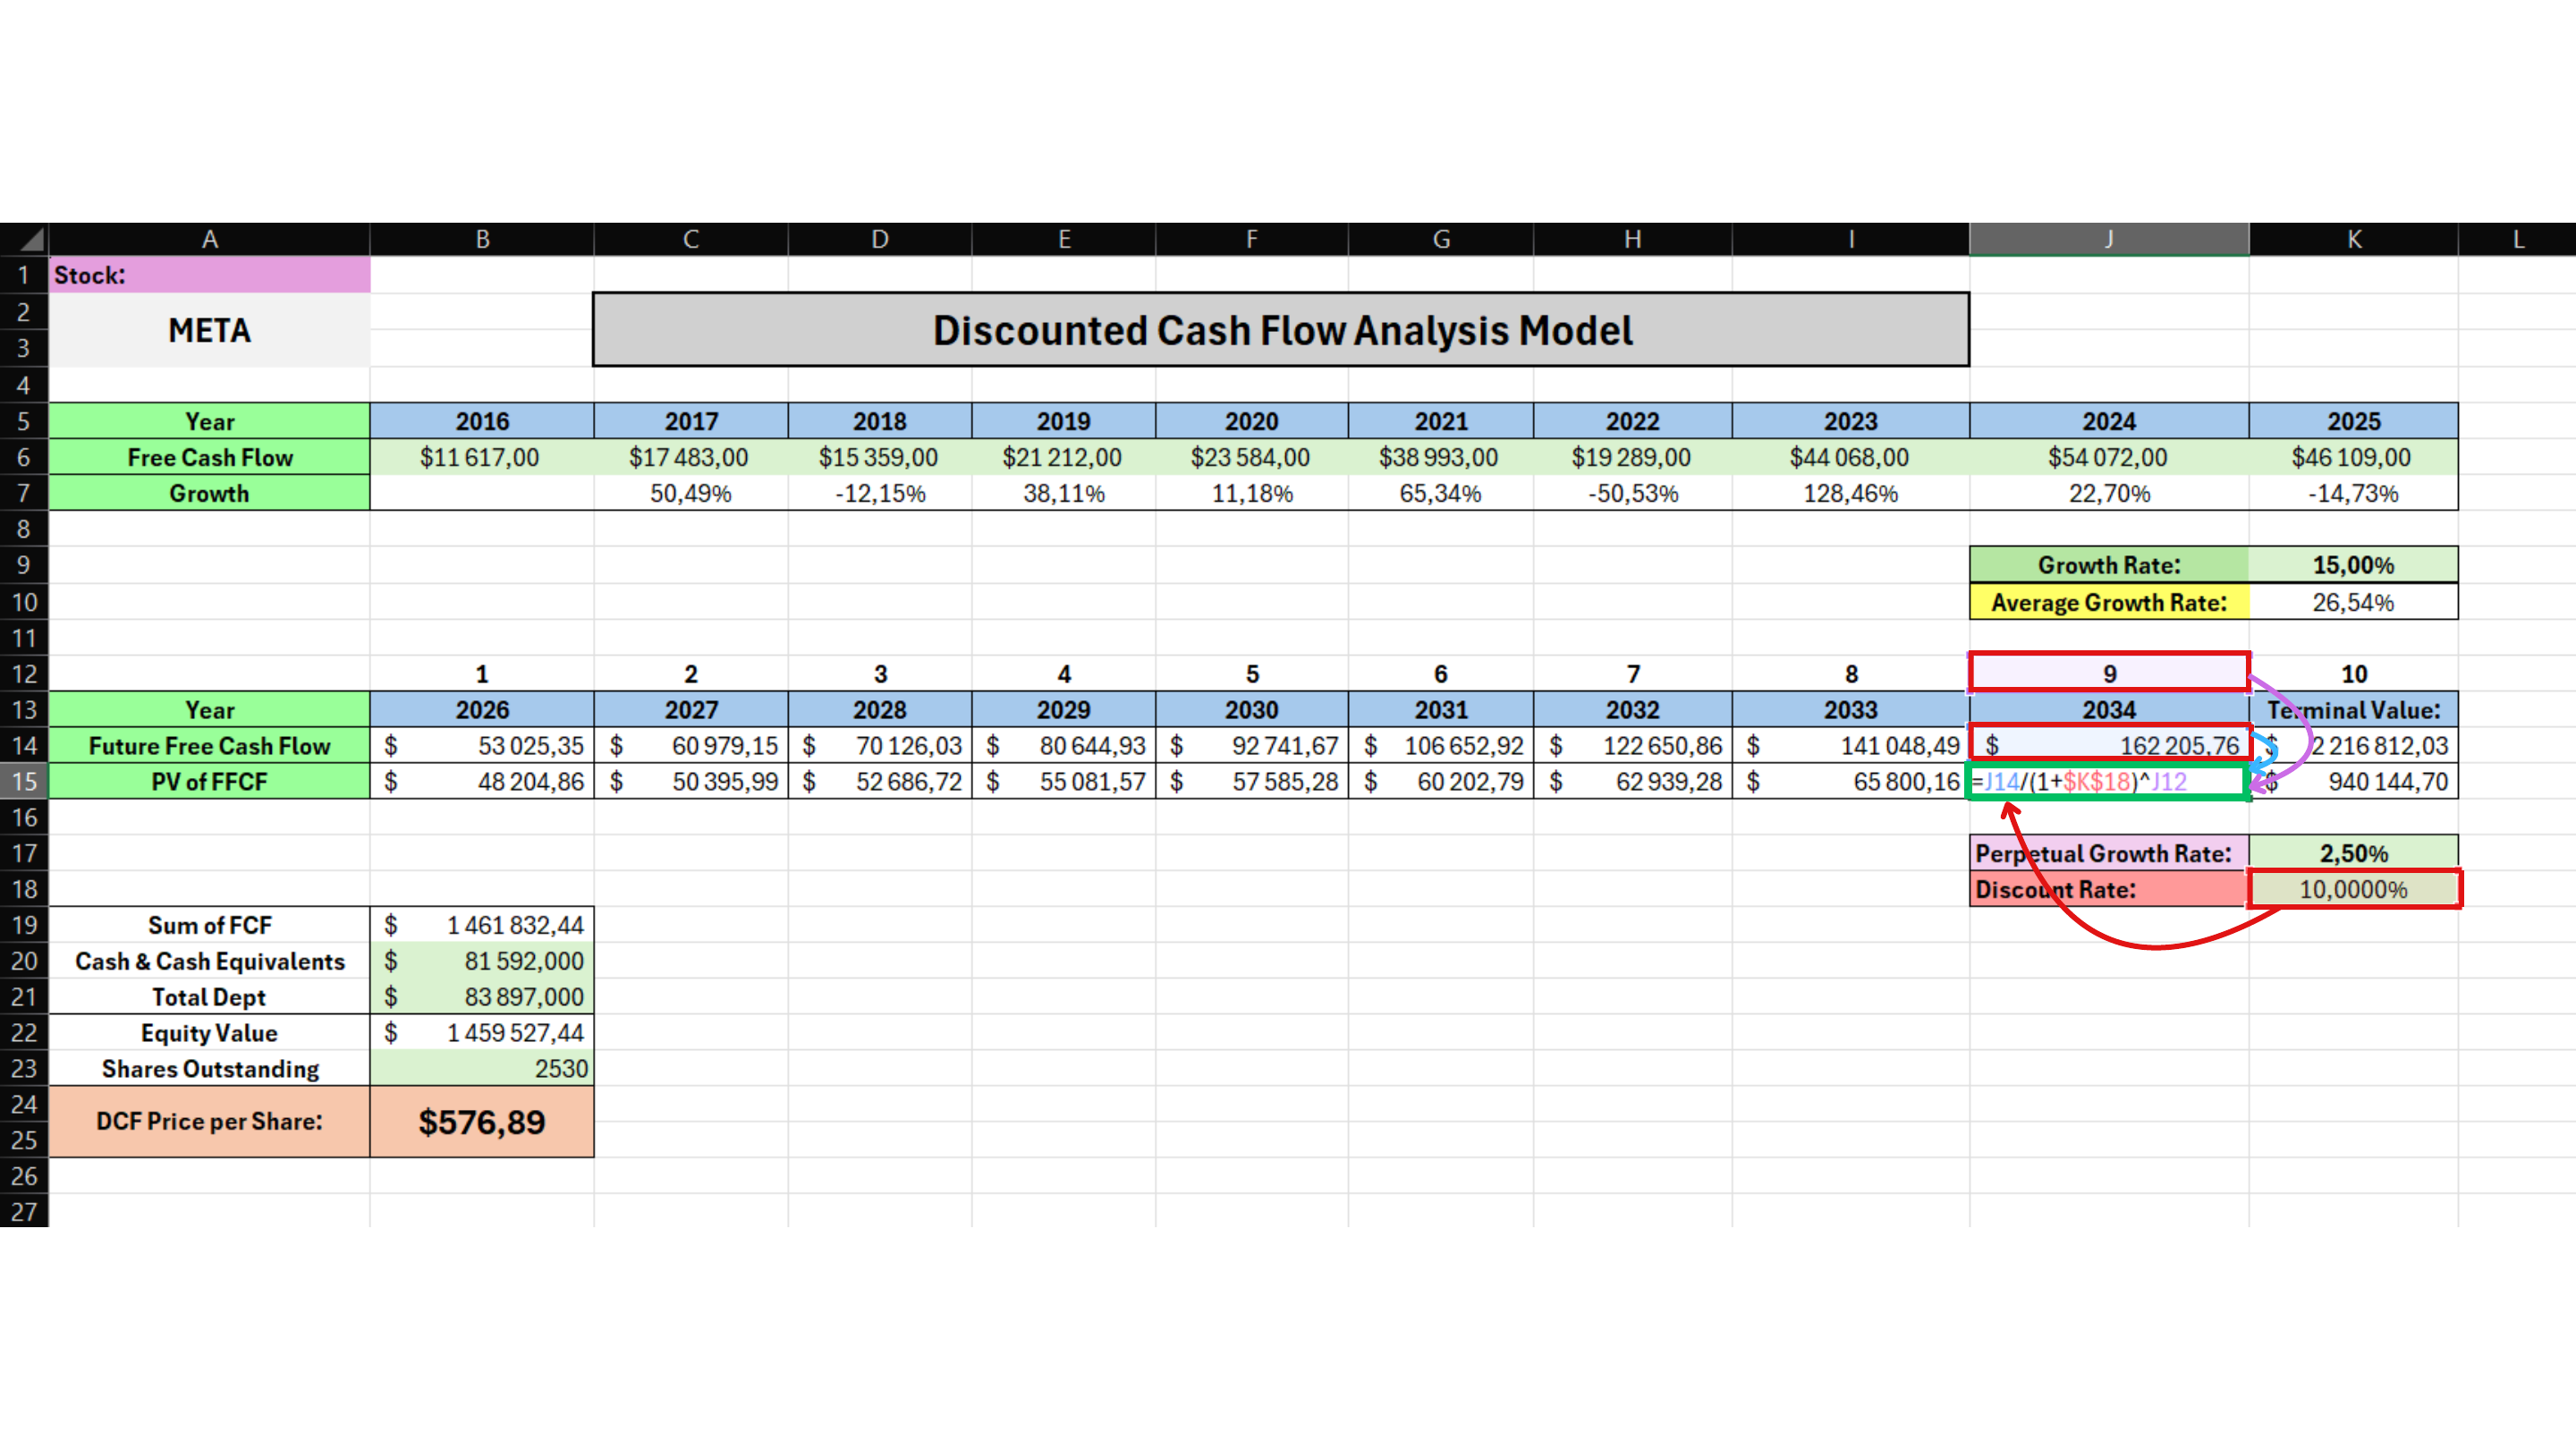
Discount every following Future Free Cash Flow in the same way through 2034. The only part that changes each year is the number of periods, or the exponent in the formula.
Calculation:
2026 -> exponent 1 / 2027 -> exponent 2 / 2028 -> exponent 3 / ... / 2034 -> exponent 9 / 162,205.76 / (1 + 10%)^9 = 68,791.08
Discount the Terminal Value
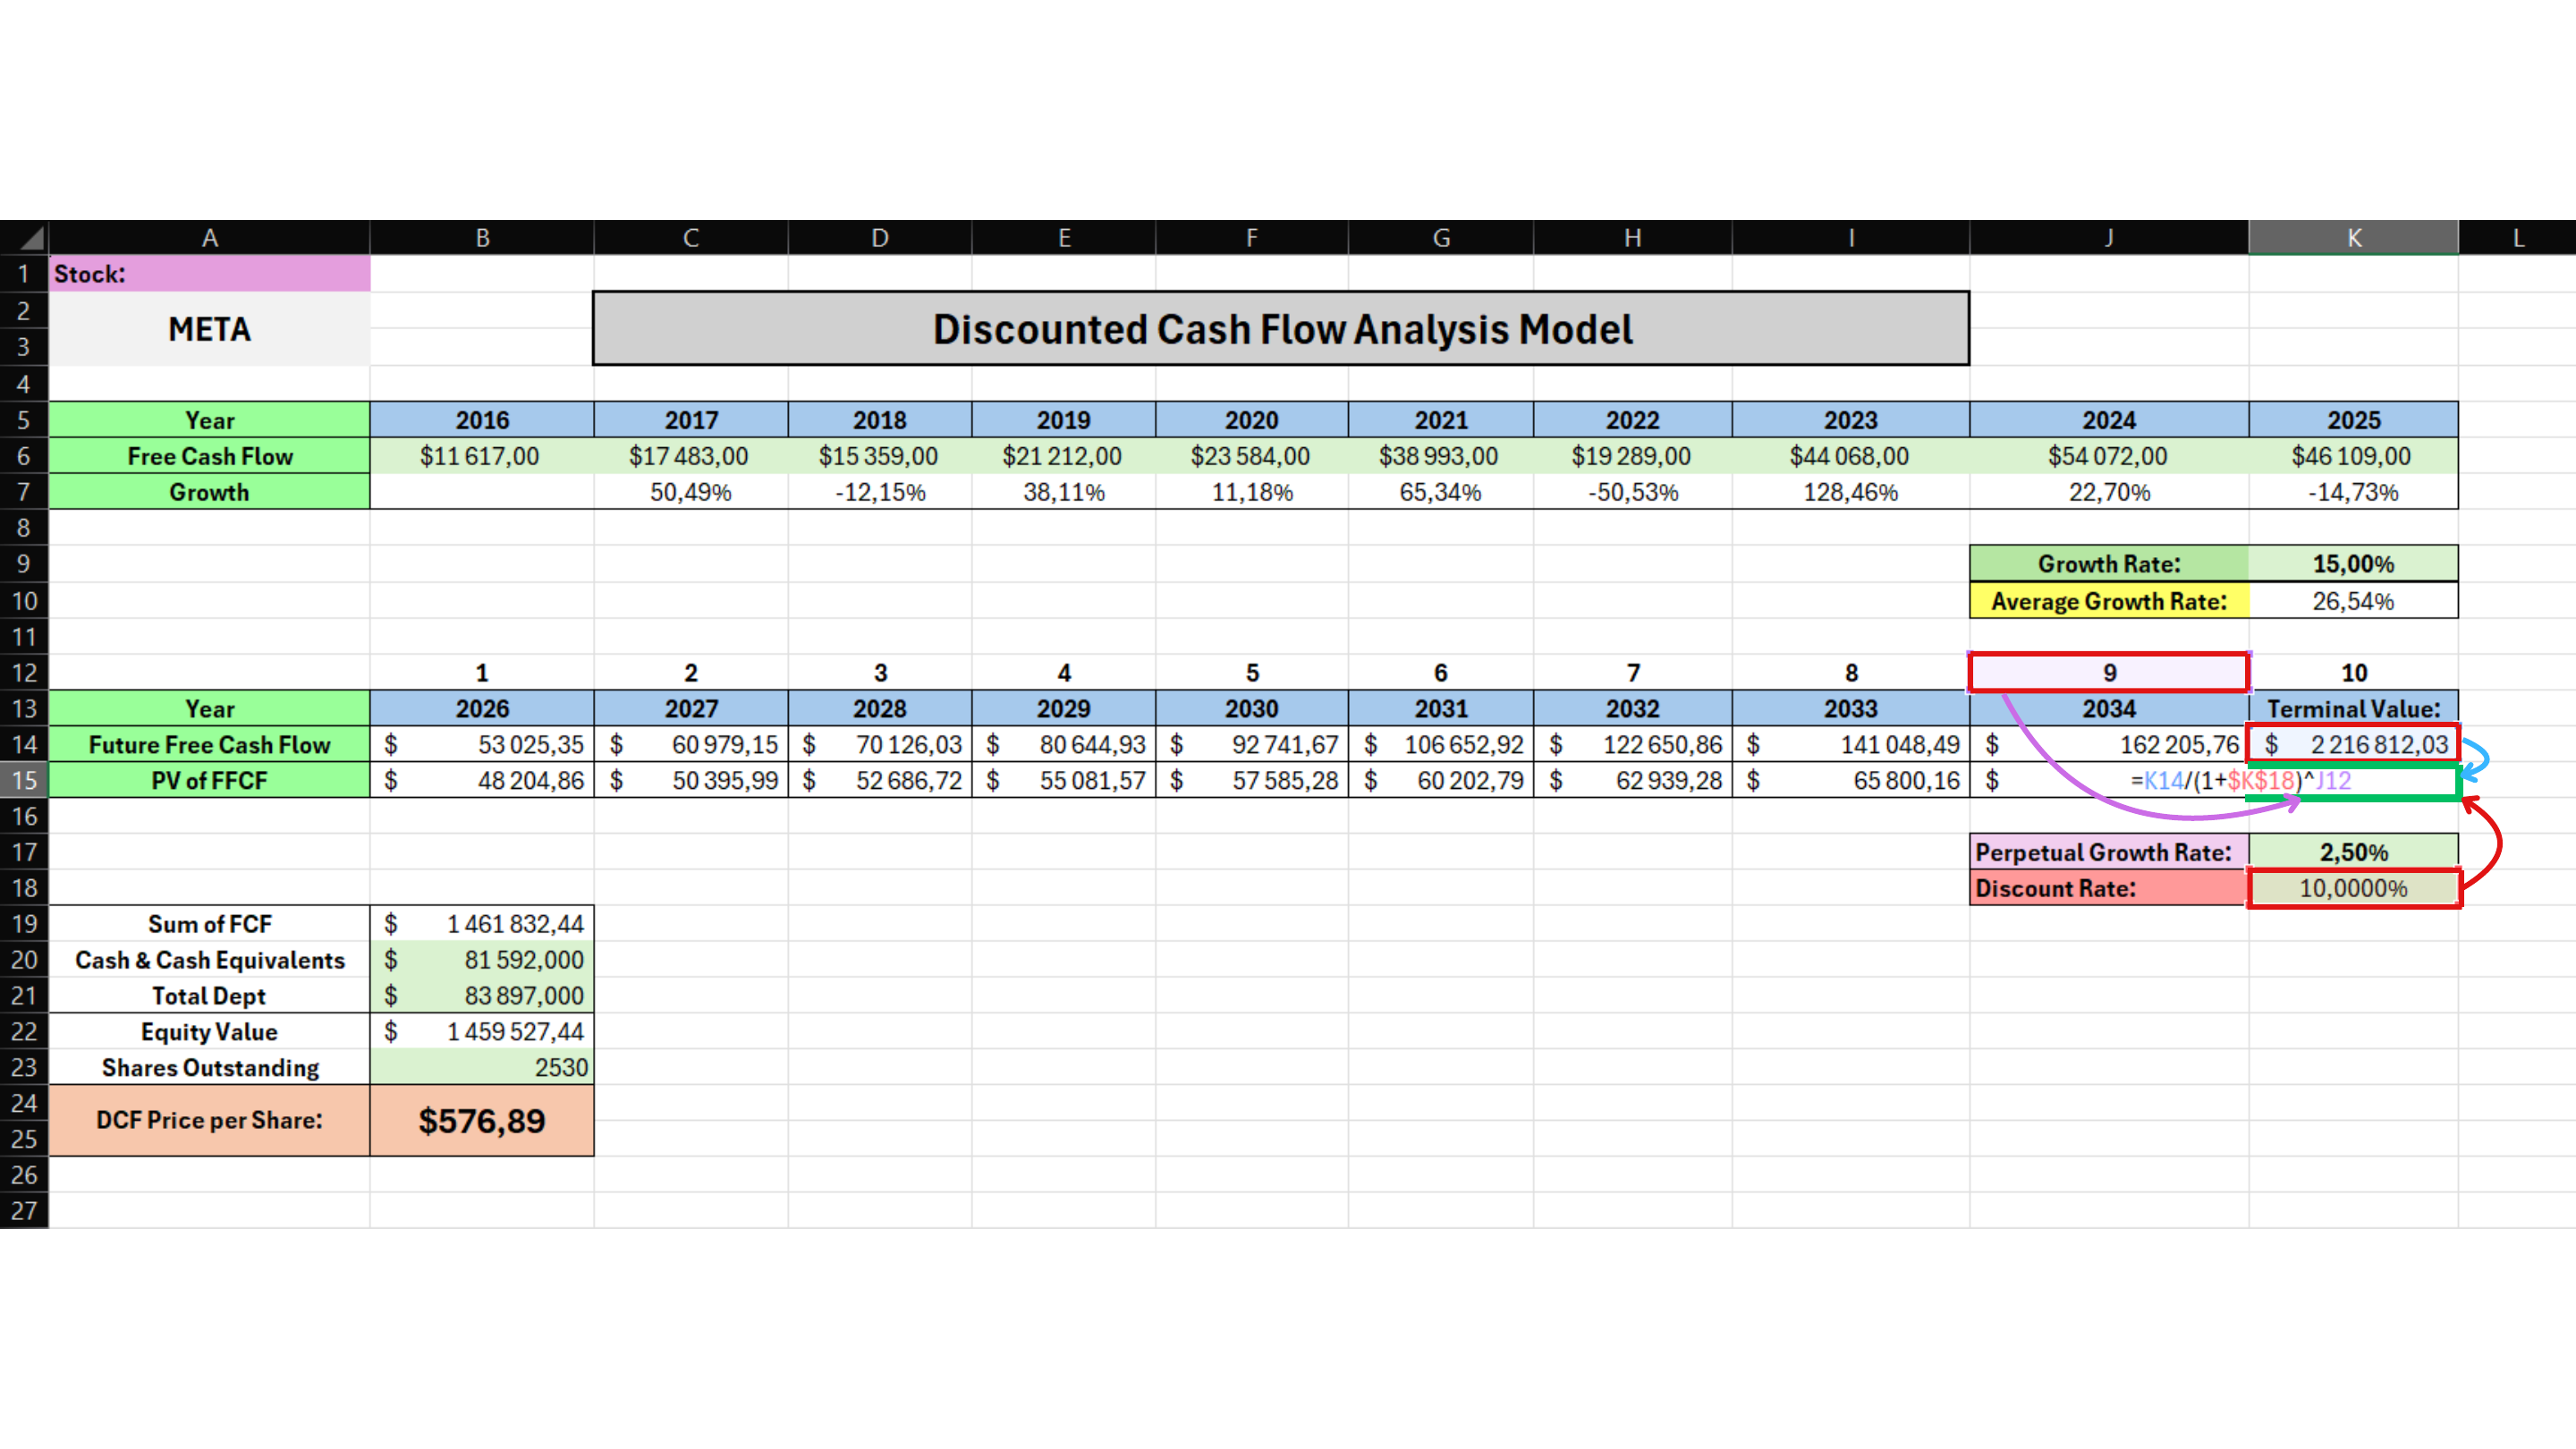
We calculated Terminal Value in Step 6, but this value also lies in the future. We therefore need to convert it to today's value just like the other future cash flows.
Calculation:
PV of Terminal Value = Terminal Value / (1 + Discount Rate)^9 / 2,216,812.03 / (1 + 10%)^9 = 940,144.70
Because Terminal Value represents the value at the end of 2034, we discount it over the same 9 periods as the 2034 cash flow.
Add All Present Values Together
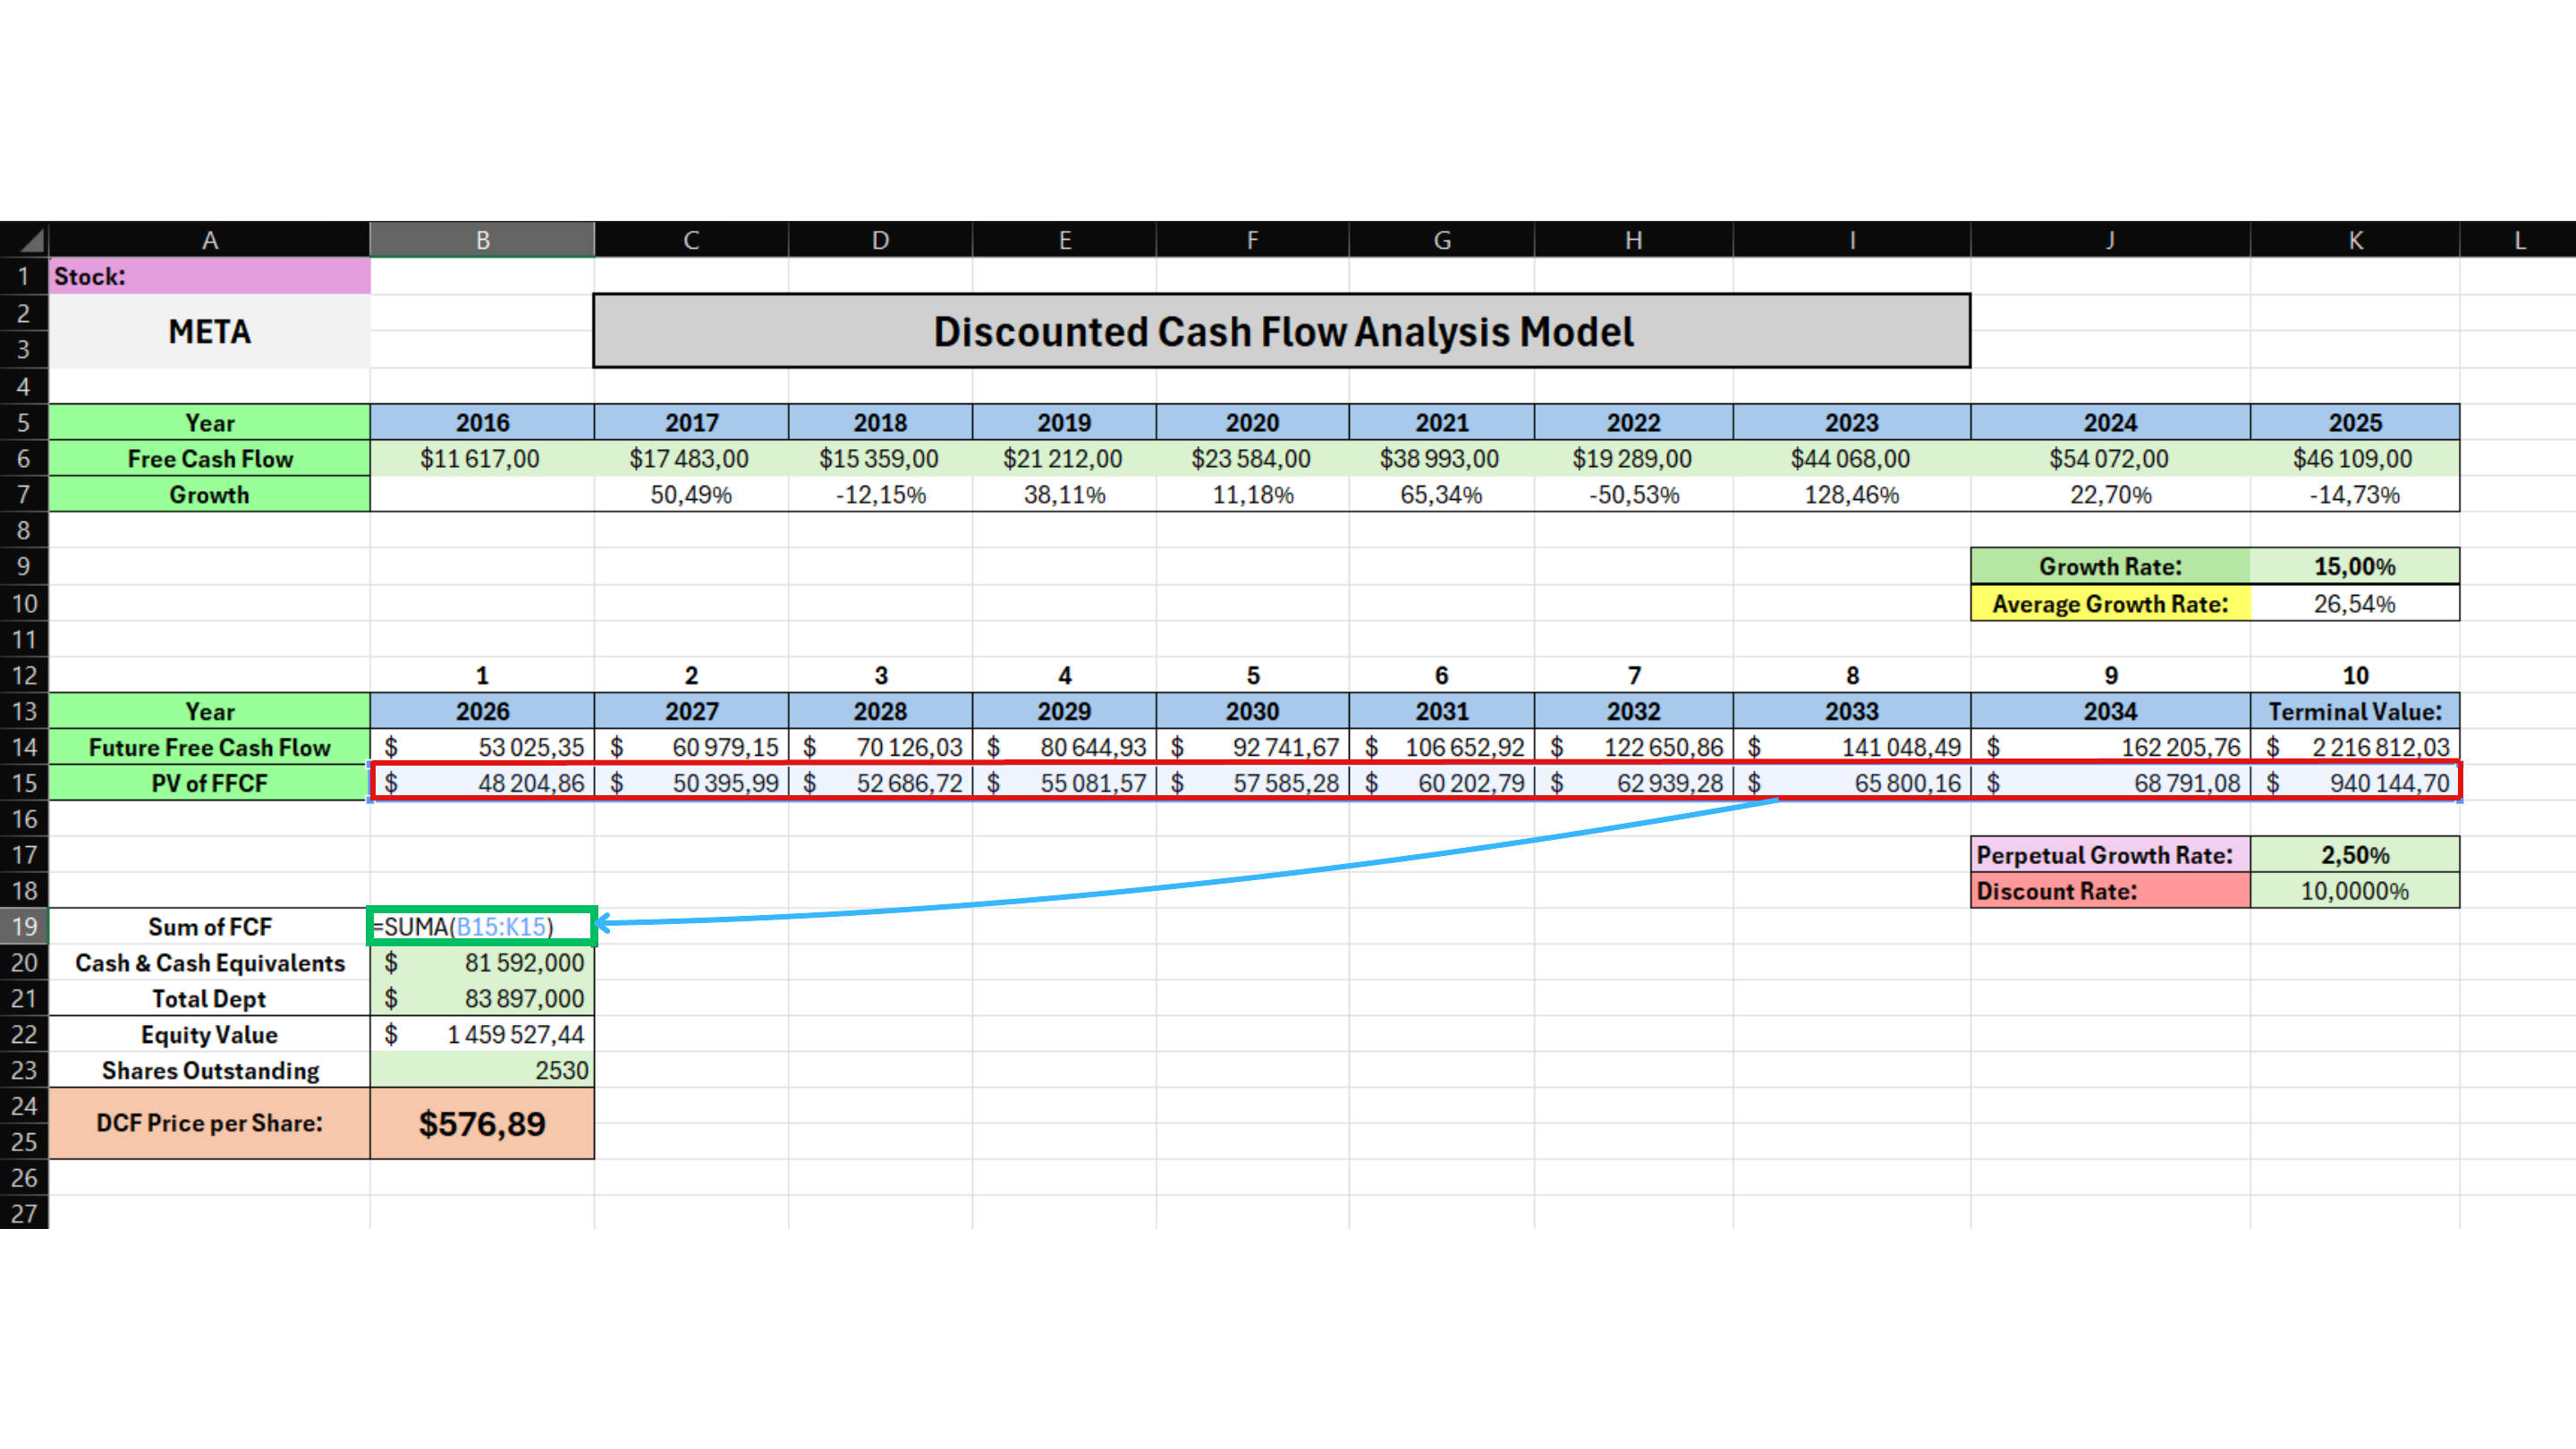
All future cash flows have now been converted into today's value. Add the entire PV of FFCF row, including the discounted Terminal Value.
Calculation:
=SUM(B15:K15) / Result: 1,461,832.44
This gives us the value of the company's projected future cash flows expressed in today's money.
Calculate Equity Value
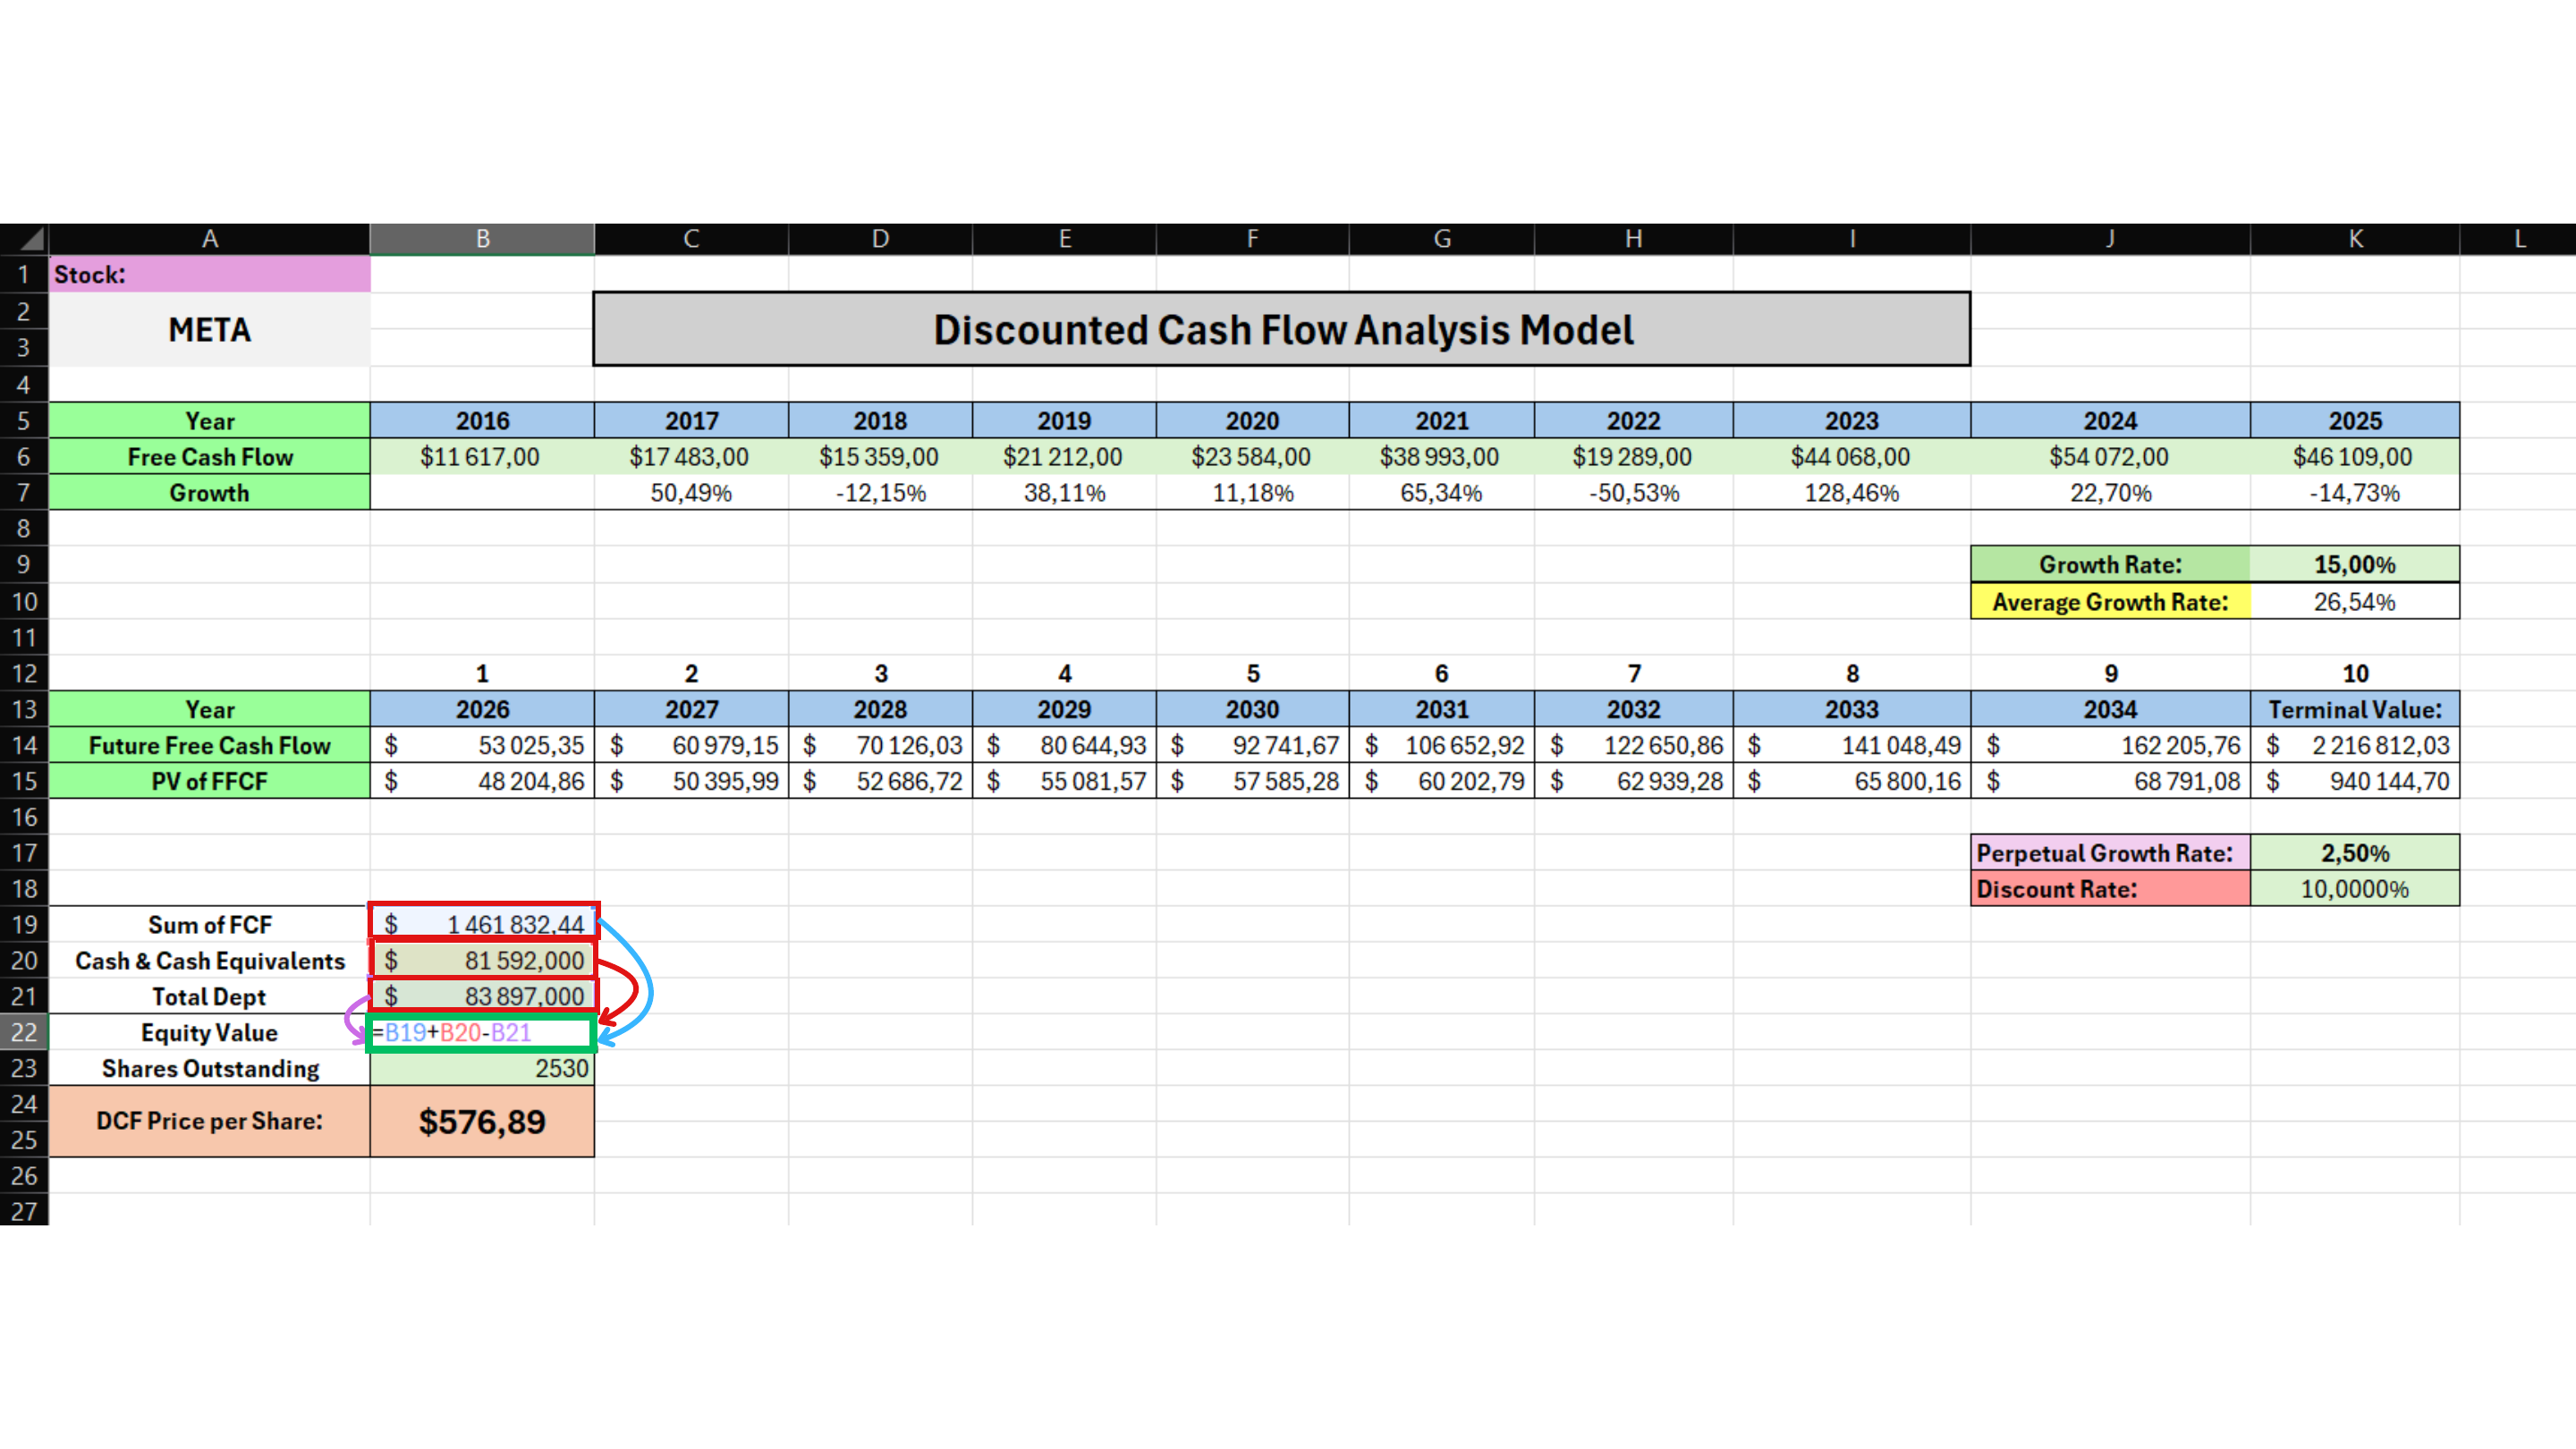
Now add Cash & Cash Equivalents to the calculated business value and subtract Total Debt. The result is the value attributable to shareholders - Equity Value.
Calculation:
Equity Value = Sum of FCF + Cash & Cash Equivalents - Total Debt / 1,461,832.44 + 81,592 - 83,897 = 1,459,527.44
Calculate the Intrinsic Value Per Share
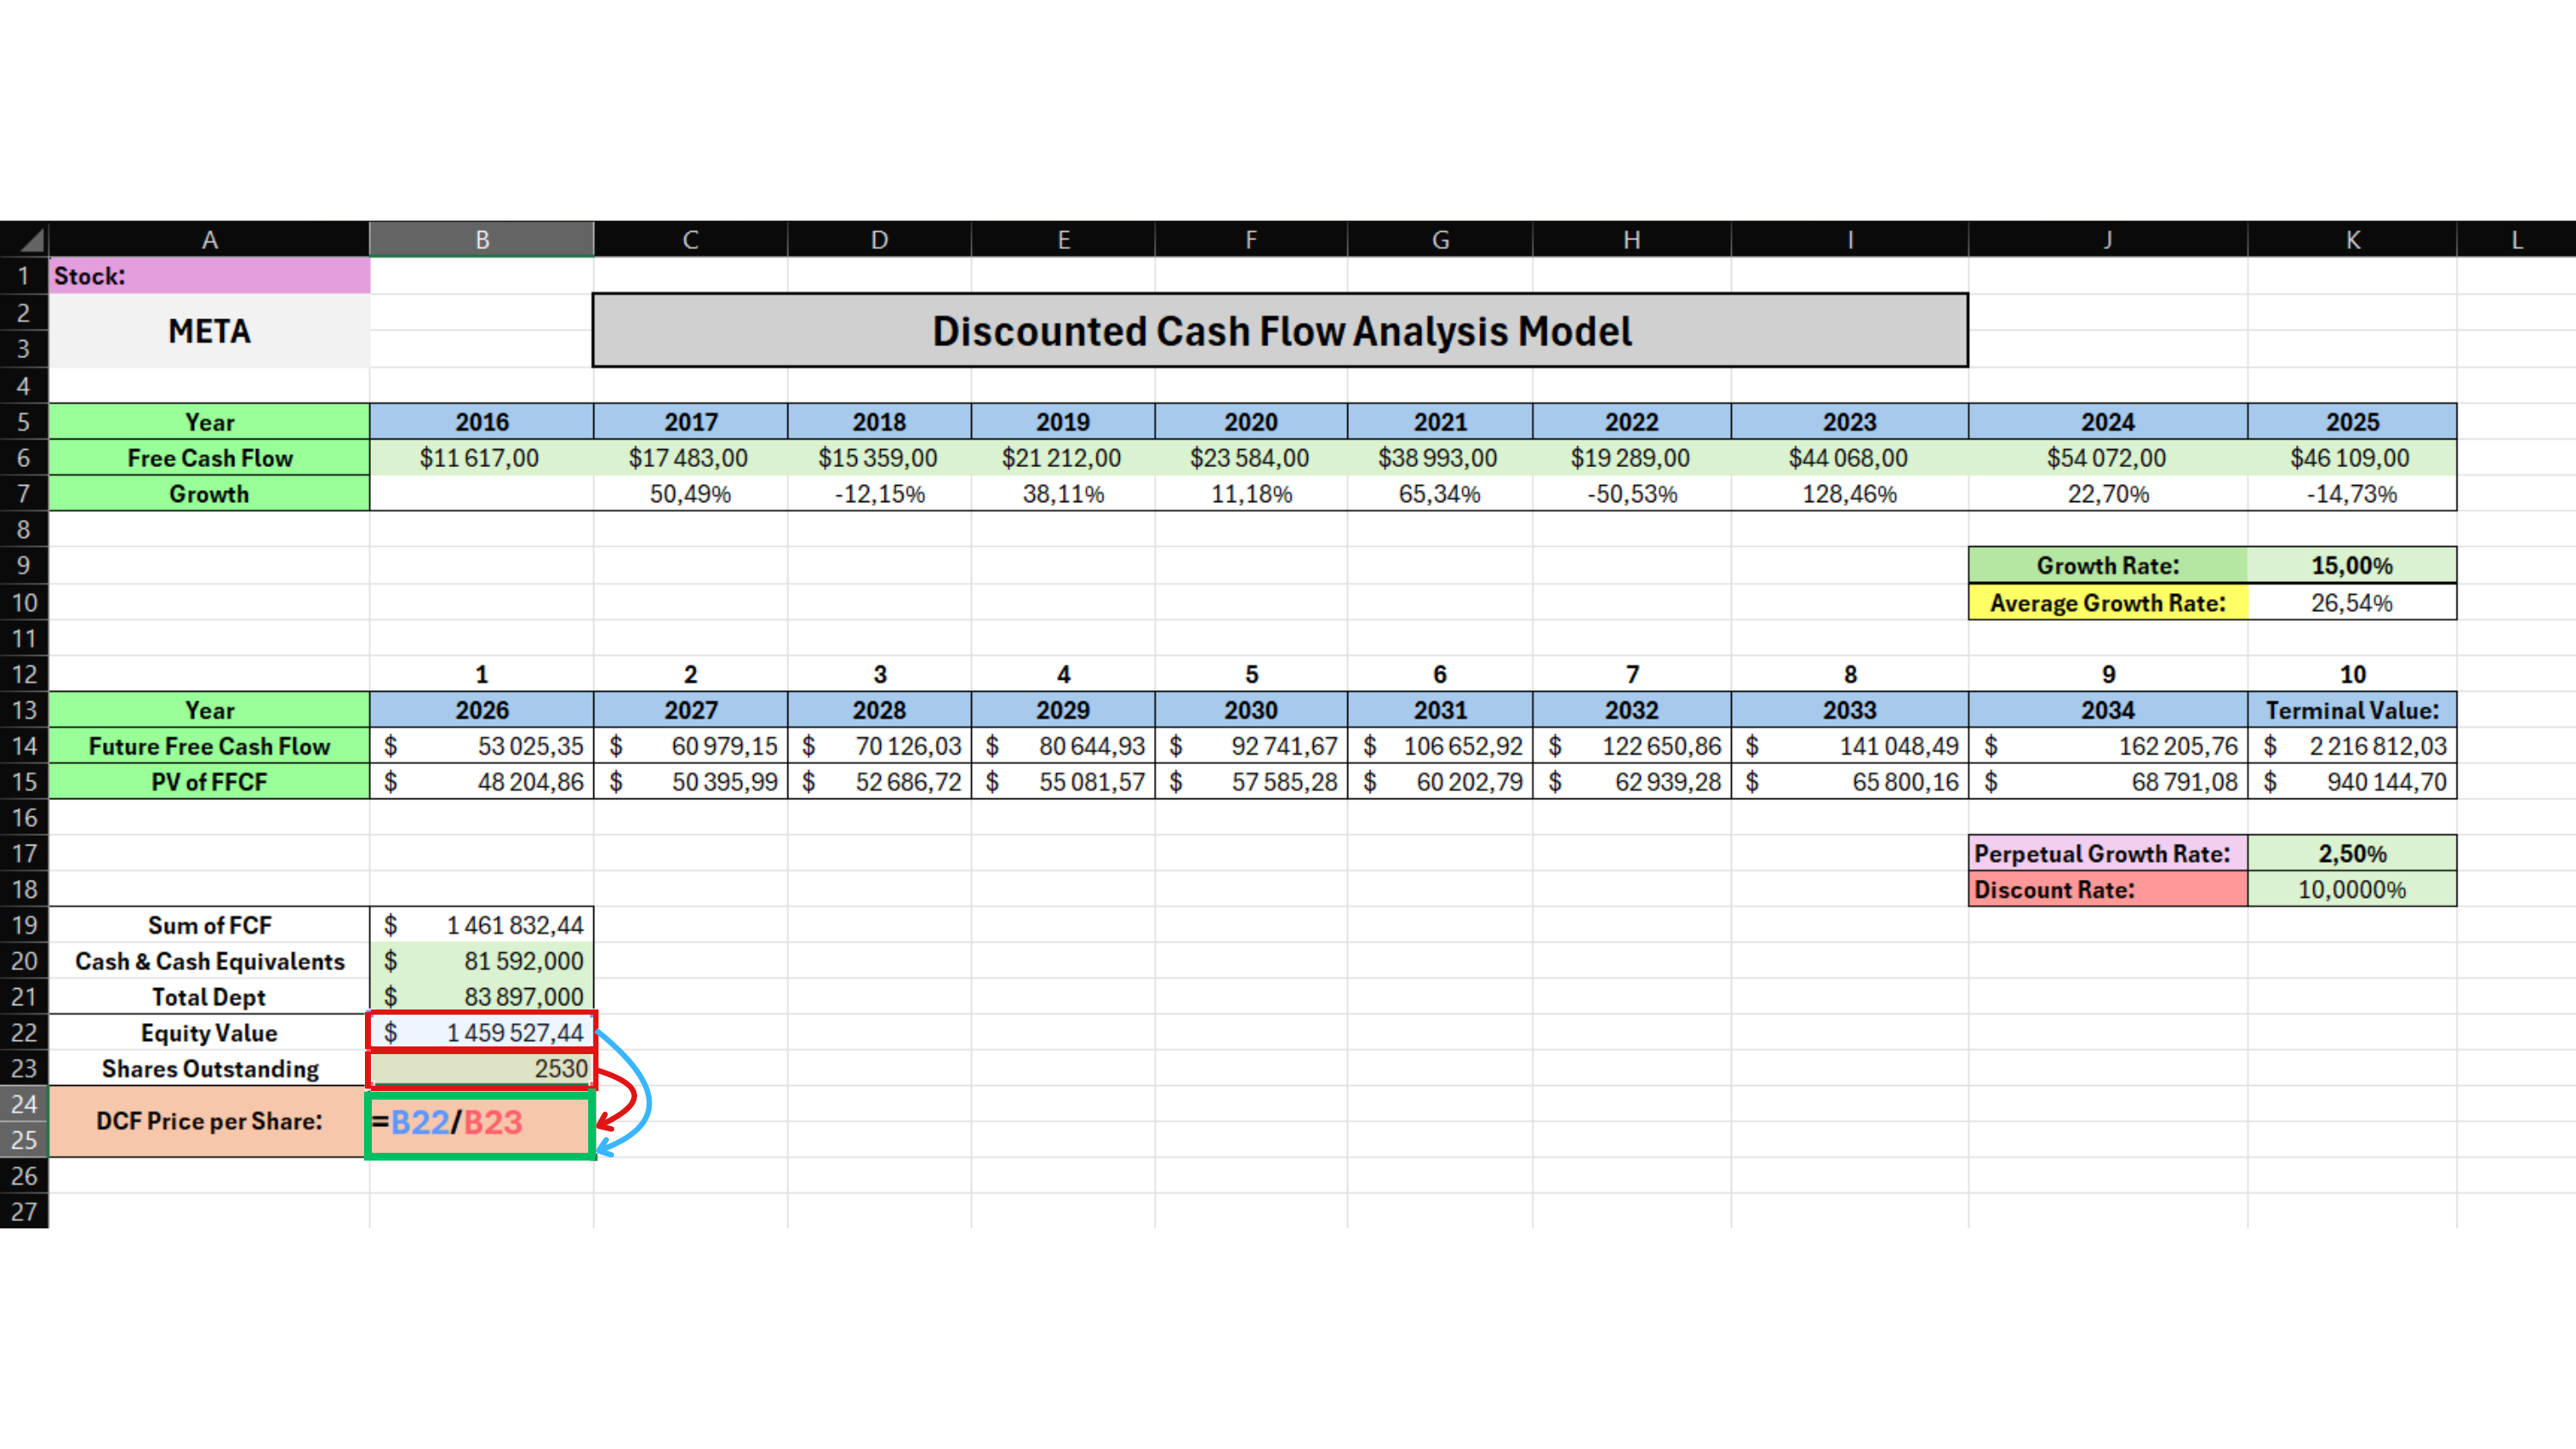
The final step is to convert the total Equity Value into the value of one share. Divide Equity Value by the current number of Shares Outstanding.
Calculation:
DCF Price per Share = Equity Value / Shares Outstanding / 1,459,527.44 / 2,530 = $576.89
This is the estimated intrinsic value of one share based on the assumptions used in our DCF model.
Note: A DCF result is not the exact 'correct price' of a stock. It is an estimate based on the assumptions you choose, and changing the Growth Rate, Perpetual Growth Rate, or Discount Rate can significantly change the final value.
How to Set the Main DCF Assumptions
Discount Rate, Growth Rate and Perpetual Growth Rate can significantly change the final intrinsic value.
1. Discount Rate
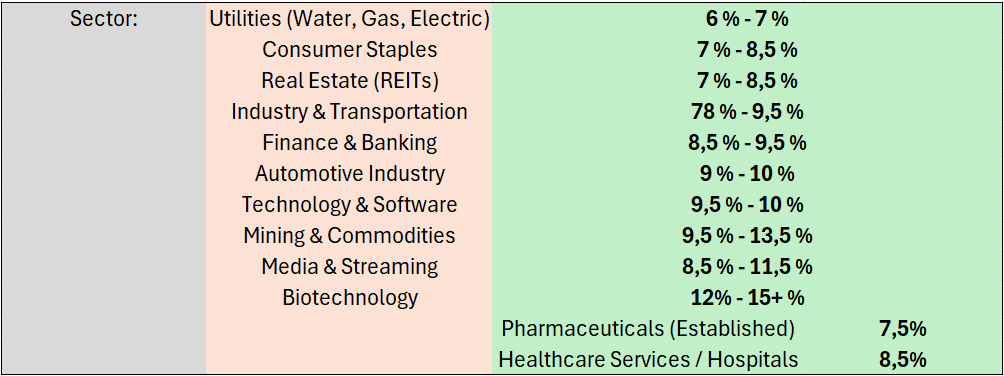
The table on the right shows rough discount rate ranges by sector. The riskier or more cyclical the sector, the higher the Discount Rate investors usually use.
For more accurate results, use the company-specific WACC from GuruFocus. WACC reflects both the cost of equity and the cost of debt, so it can be better than a simple sector estimate.
Find WACC on GuruFocus →2. Growth Rate
Growth Rate is based on your own judgement and how much you believe in the company’s future. In this simple DCF method, investors often use 10% for a more conservative scenario or 15% for a more optimistic one.
3. Perpetual Growth Rate
Perpetual Growth Rate represents the company’s long-term growth after the detailed forecast period. Many DCF models use around 2.5%, because a business should not be assumed to grow much faster than the economy forever.
A higher number can significantly inflate the intrinsic value.
Note: These are not “correct numbers.” They are assumptions chosen by the investor based on business quality, risk and the investment scenario.